⚡ GRID STATUS: QUIET
The grid is stable — nominal line voltage
The Sun runs a power grid, and Earth is wired into it. This deck reads the live line voltage: geomagnetic activity, solar wind, flares, sunspots, and aurora — the same instruments professionals watch, explained in plain language.
The Instruments
Tap the ⓘ on any instrument for what it measures, its source, and why it matters.
Get Storm & CME Alerts
NOAA and NASA publish the numbers. They don't tell you. The moment a geomagnetic storm, a major flare, or an Earth-directed CME is confirmed, we'll email you — no refreshing this page, no scanning raw feeds.
This is the general grid alert — the same one everyone gets. Reading it against your commissioning schematic is what the Planetary Logic Controller does.
Signing up puts you on our list — that's the deal: we watch the sky, you hear from us by email. Unsubscribe from alerts any time. Your newsletter choice remains separate.
Full accounts get the richer channel: push notifications, in-app alerts, and email — all tied to the same PLC dashboard.
Enable Space Weather Alerts in Settings →Space Weather News
The Last Seven Days
Planetary Kp Index
Geomagnetic disturbance, 3-hourly (NOAA SWPC). Kp 5 = G1 storm.
GOES X-ray Flux
Solar X-ray brightness, log scale (NOAA GOES, 0.1–0.8 nm). M/X flares can black out HF radio.
Solar Wind Speed
DSCOVR/ACE at L1 (our archive). Fast streams (>500 km/s) drive geomagnetic activity.
The Sun, Right Now
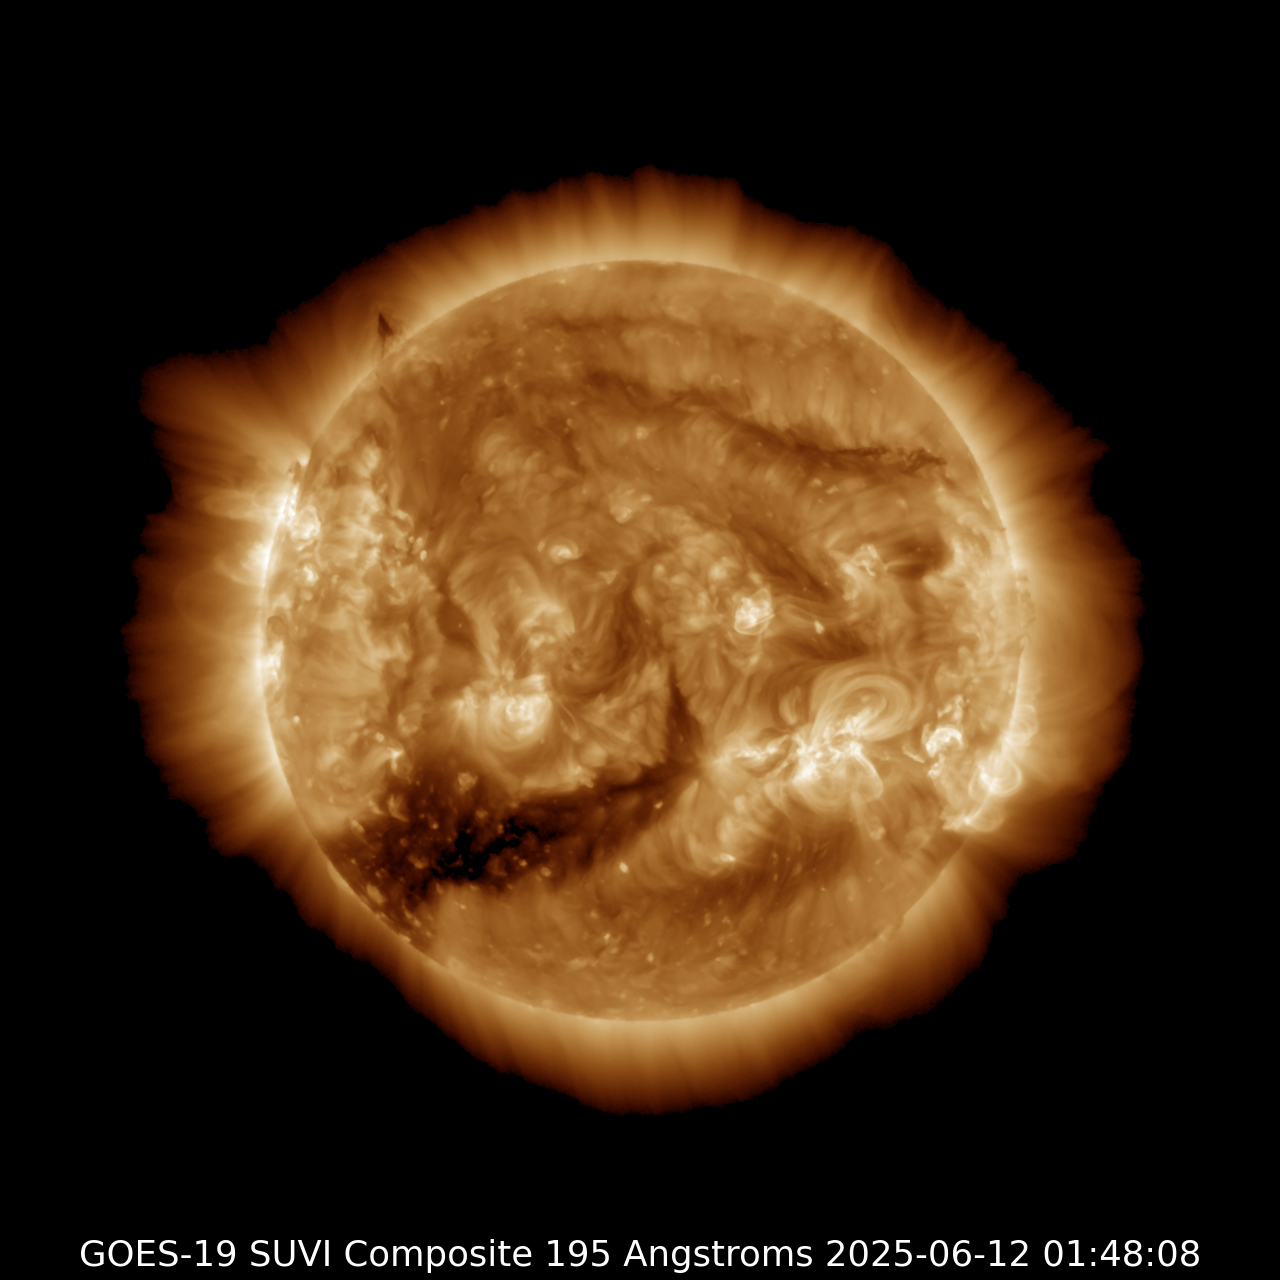
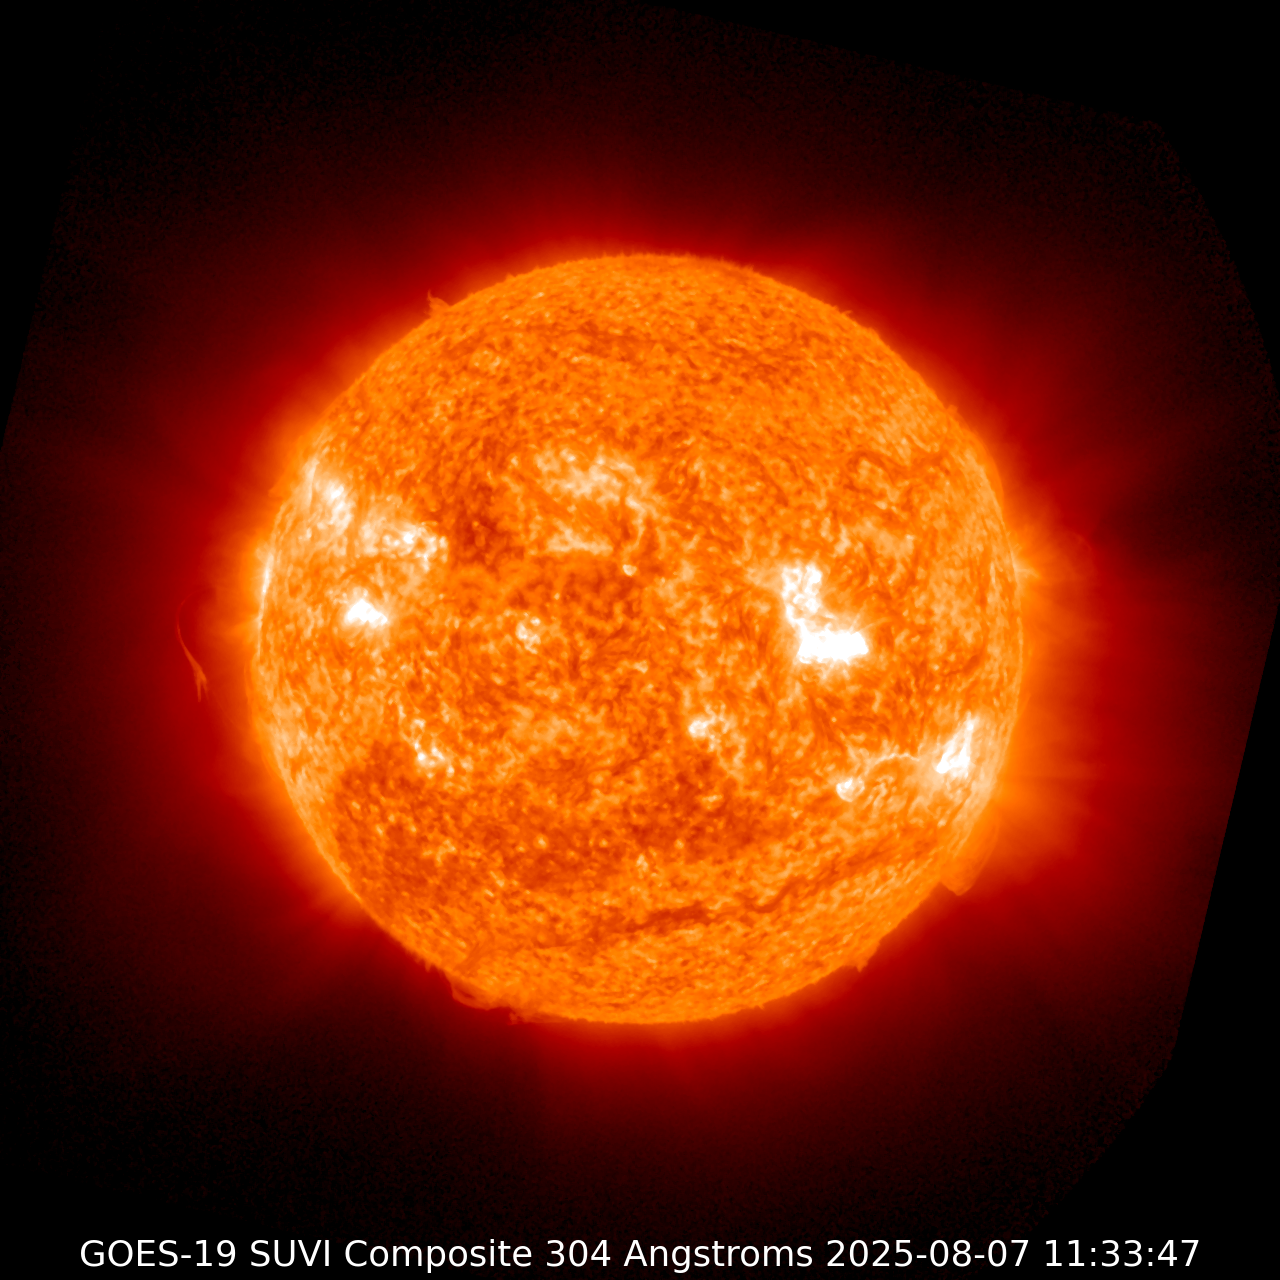
Imagery: NASA SDO · ESA/NASA SOHO · NOAA GOES SUVI (public domain, latest available frame).
Watching the Whole Circuit
NOAA's WSA-ENLIL supercomputer model — the full current run, animated: solar wind density and velocity sweeping past Earth, with every Earth-directed CME's predicted arrival. It plays on its own: the current model run, updated with every new run. Prefer a flyable Electric Universe view? Open Electric Sky Lab →
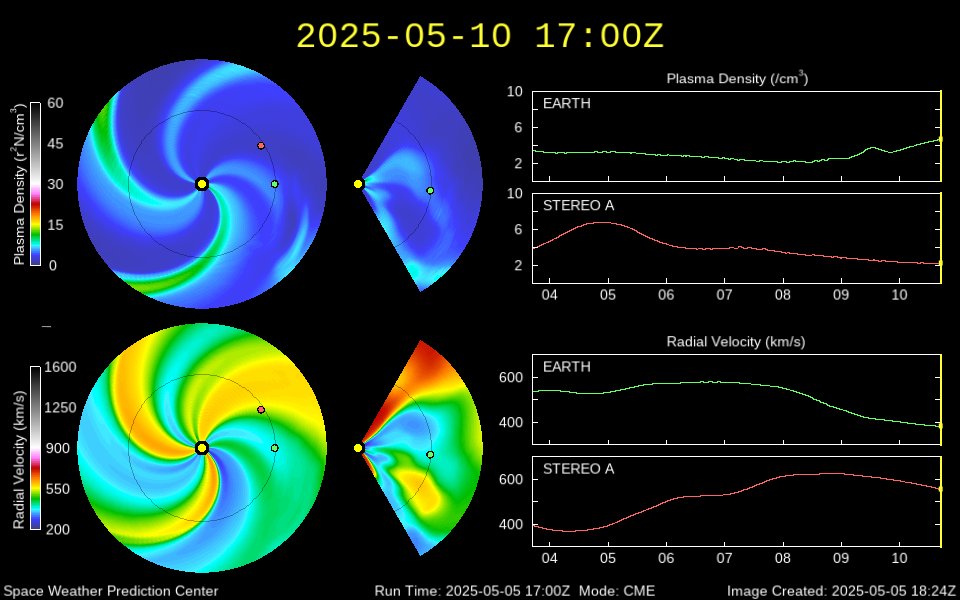
Directional sectors: real wind speeds measured at the Earth line, mapped back to their source direction via the Sun's 13.2°/day rotation (corotation). Coverage grows ~13°/day until the full 360° pinwheel matures at one solar rotation (~27 days); brightness fades with data age — bright = fresh measurement, faint = older in the rotation, dim = period average. CME cones: direction & width from NASA DONKI, front position from launch speed × elapsed time (ballistic estimate; red solid = Earth-directed, orange dashed = missing us). Planet positions are a ~1° approximation, orbit spacing log-compressed — illustrative, not your commissioning schematic.
Aurora Oval — Live Forecast
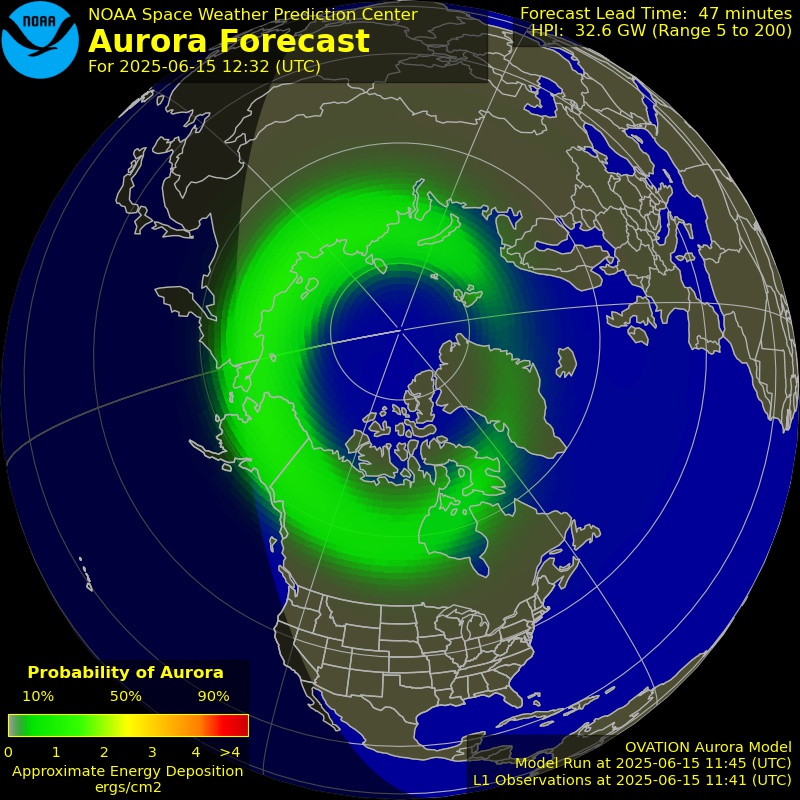
The green-to-red oval is where aurora is most likely in the next half hour. The stronger the storm, the further the oval spills toward the equator.
Rule of thumb: Kp 5 reaches the northern US, Kp 7+ reaches the mid-latitudes. Tonight's odds ride on the Kp gauge above.
It plays the last 24 hours of the oval breathing with the solar wind. Click it for the full view and a video to share.
Recent Notable CMEs
No notable coronal mass ejections logged in the last several days.
Live NOAA Plots
The same trend plots the forecasters at NOAA's Space Weather Prediction Center watch: X-ray flux, proton flux, and the planetary K-index over the last few days.
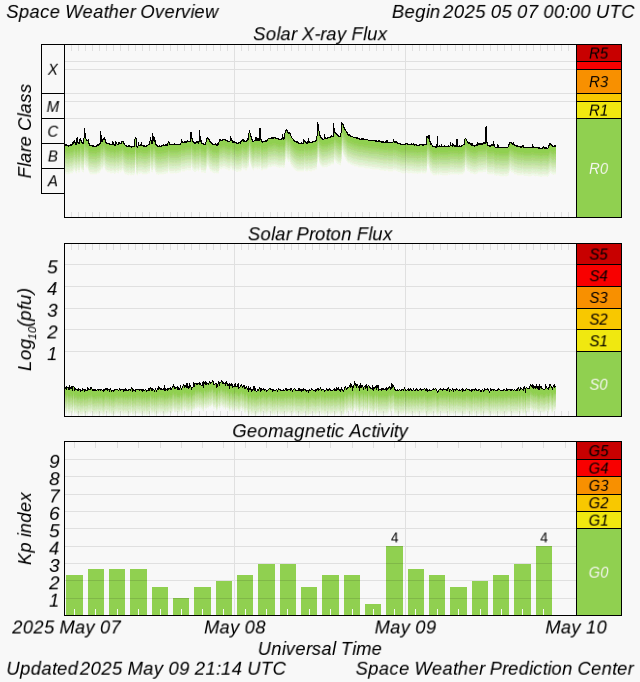
Source: NOAA Space Weather Prediction Center (public domain, refreshed continuously).
Solar Cycle & Storm History
Today in context: the sunspot record back to the 1700s with every solar cycle marked, and the recent Kp storm history. This is the same source data behind every Electric Astrology commissioning schematic.
Historical Field Records — Source Data
The Data Behind Your Commissioning Voltage
This is the actual archive — not a summary, not a chart generated from internal assumptions. SILSO sunspot records back to 1818. GFZ Potsdam Kp readings back to 1932. Your commissioning voltage was pulled directly from these datasets. Drag the handles at the bottom of each chart to zoom in.
Solar Activity — International Sunspot Number (SSN)
SILSO · Royal Observatory of Belgium · 1818–present
LOADING ARCHIVE…
Geomagnetic Activity — Kp Index (Daily Average)
GFZ Potsdam · Helmholtz Centre · 1932–present
LOADING ARCHIVE…
SSN v2.0 — SILSO, Royal Observatory of Belgium (1818–present) · Kp 3-hourly definitive — GFZ Potsdam / Helmholtz Centre (1932–present) · Data bundled locally; no third-party requests.
Instrument Glossary
Global geomagnetic disturbance, 0–9 scale, updated every 3 hours. 0–3 quiet, 4 active, 5+ storm (NOAA G1–G5). Higher Kp pushes aurora toward the equator.
Kp 5 (G1) reaches the northern US. Kp 7+ (G3) reaches mid-latitudes. Odds track the Kp gauge above and the oval forecast directly.
Charged plasma streaming off the Sun at 300–800+ km/s, carrying its magnetic field. Faster, denser wind with a south-pointing field (negative Bz) transfers more energy into Earth’s magnetosphere.
Solar flares ranked A / B / C / M / X — each class ten times brighter than the last. M and X flares can black out dayside radio within minutes.
Magnetically intense surface regions, counted daily since the 1700s, rising and falling on an ~11-year cycle. We’re in Cycle 25, near maximum — why storms and aurora have been so frequent.
Measurable on grids, satellites, GPS, radio. Whether it registers in human physiology is an open question — the Electric Astrology app lets you compare your own wearable data against it.
Instrument Deep-Dives
This is the grid. What does it do to your circuit?
Everything on this page is the line voltage — the same for everyone. The Planetary Logic Controller reads it against your wiring: the commissioning schematic set at your birth. See it running on a real one first.