Twice as many geomagnetic storms come in the equinox months as in the solstice months
Russell and McPherron showed that storms bunch at the equinoxes because that is when Earth’s magnetosphere is most likely to see a southward component of the Sun’s magnetic field.
The short version
Storm counts from 1875 to 1927 and 1958 to 1969 show twice as many geomagnetic storms in the equinox months as in the solstice months. In 1973 Russell and McPherron proposed why: around the equinoxes, Earth's magnetosphere is most likely to see the Sun's magnetic field with a southward component, the direction that lets energy in.
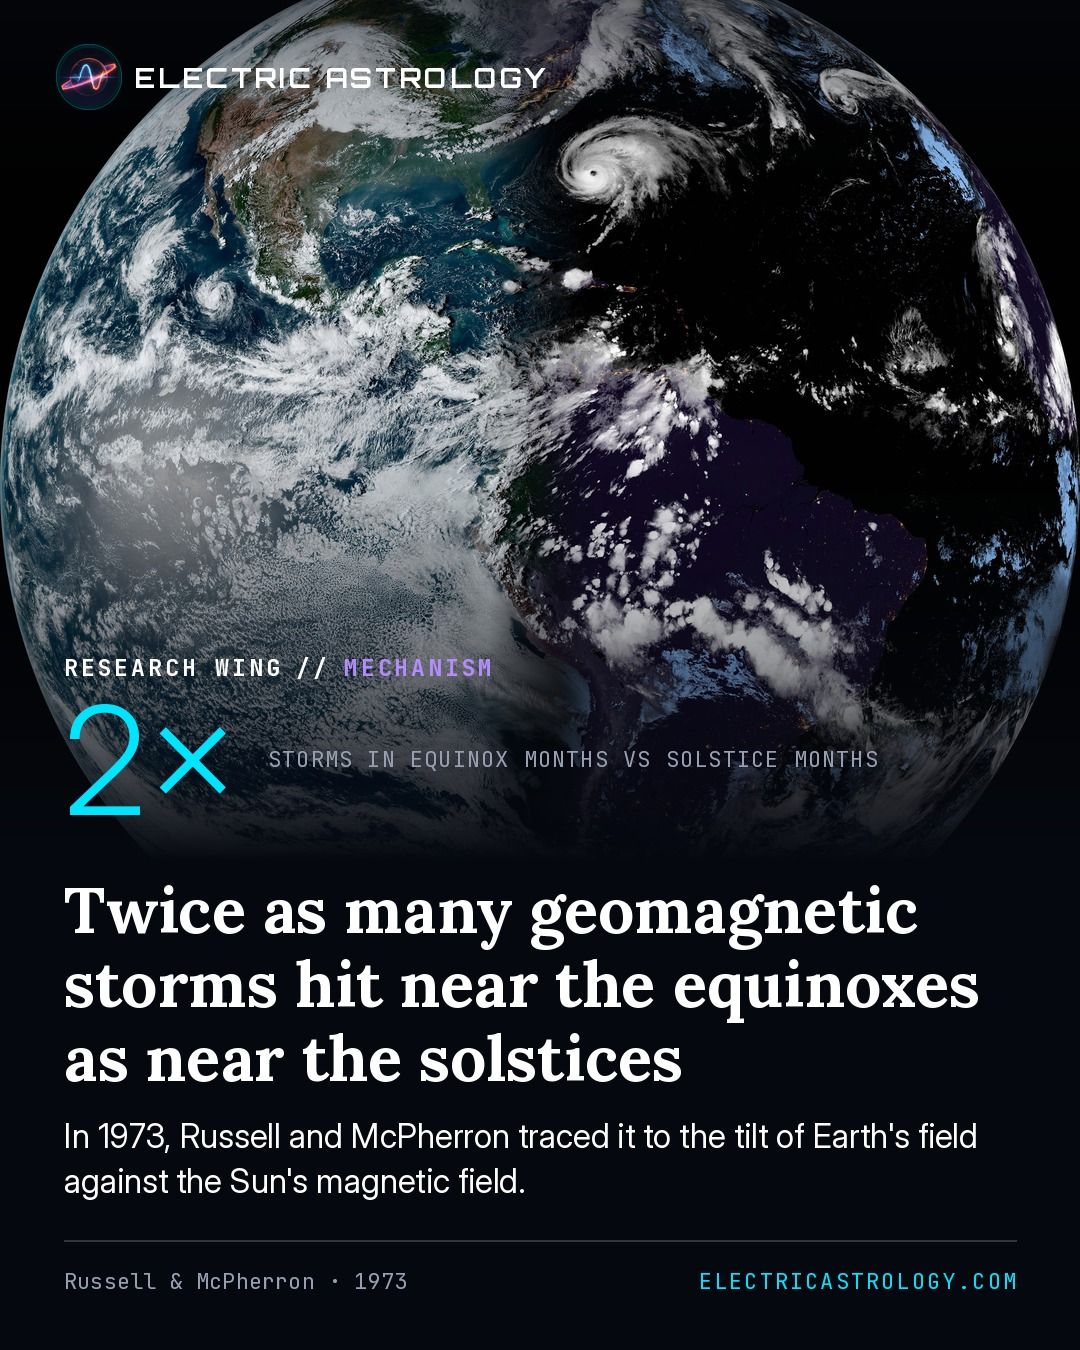
2×
Storms in the equinox months against the solstice months, from storm counts for 1875 to 1927 and 1958 to 1969.
The paper
Semiannual variation of geomagnetic activity
Russell, C. T., McPherron, R. L. (1973). Semiannual variation of geomagnetic activity. Journal of Geophysical Research, 78(1), 92–108.
Checked against the paper’s full text on November 9, 2026.
What they measured
They examined the yearly pattern of geomagnetic activity in the U index from 1872 to 1930, counted storms by their Dst signature from 1958 to 1969 (leaving out 1959 and 1960), and sorted activity from 1962 to 1969 by the polarity of the interplanetary magnetic field.
Against these data they tested four models of how the solar wind couples to Earth: three built on the southward component of the interplanetary field, one on the Kelvin-Helmholtz instability.
What they found
Twice as many storms occur, on average, in the equinox months as in the solstice months, which could come from a 40% increase in the average energy put in during a storm at the equinoxes.
Their model puts the largest southward component near 22:00 UT on about April 5 and 10:00 UT on about October 5. A simple merging model predicted only a 2.5% variation, an order of magnitude smaller than observed, and peaks at the wrong time of year; the Kelvin-Helmholtz model got the timing right but cannot predict the size of the effect.
Sorted by the polarity of the interplanetary field, the twice-yearly pattern splits into two yearly ones, one peaking in spring and one in fall, as the model predicts. The mechanism is the varying probability through the year of a southward component of the interplanetary magnetic field, as seen by the magnetosphere.
How it bears on the hypothesis
MechanismShows a working part of the circuit: a receiver in the body, a current in space, a field that couples them.
This is the paper behind one of Electric Astrology’s central observations: the calendar the zodiac marks, with its equinoxes and solstices, lines up with a real yearly rhythm in how much solar-wind energy Earth’s magnetosphere takes in. Around the equinoxes, Earth’s geometry makes coupling to the solar wind more likely; around the solstices, less.
Electric Astrology’s own count of 94 years of the GFZ Potsdam Kp record, shown on the Cosmic Commissioning page, wraps the same rhythm around the zodiac: the stormiest sign is Aries and the quietest is Capricorn.
The authors’ own caution: The authors note their model’s daily pattern does not match ground-based data, and that a quantitative model must wait for better knowledge of how the solar wind couples to the magnetosphere.