⚡ Live Space Weather · Instrument Deep-Dive

Schumann Resonance Today

Global lightning makes the gap between Earth and the ionosphere ring like a bell, near 7.83 Hz. There is no reliable open, real-time feed of that ringing, so we compute our own from the physics, show every step, and let you hear it.

Resonator · nowModeled
SR1 fundamental
7.71 Hz
Q 3.5
SR2
14.48 Hz
Q 1.7
X-ray (GOES)
…
below M1: no flare shift
Clock
15:17 UT
drives the lightning centres

Horizontal magnetic power at Tomsk, Siberia, relative units. Computed from the Ishaq & Jones cavity model driven by three tropical lightning centres at today's UTC time.

Lightning clicks at the real global rate ringing the modeled modes, shifted up four octaves (×16) so 7.8 Hz becomes about 123 Hz. Headphones help.

Last 24 hours · Tomsk, SiberiaModeled
Computing the last 24 hours…

How to read it: each bright horizontal band is one resonance mode; the lowest, SR1, is the famous ~7.8 Hz. The amber lanes above show which lightning centre is in its afternoon storms. Watch the bands brighten when one lights up. Hover or tap the chart for the details at any moment.

How a planet becomes a bell

The ground and the ionosphere, 60 to 100 km up, are both conductors. The air between them is not. That makes a spherical cavity wrapped around the planet, and every lightning stroke strikes it like a hammer.

Loading the cavity…
Earth–ionosphere cavity · ionosphere height ×20
⚡ ELECTRIC ASTROLOGY
electricastrology.com
■ field up■ field downdark = node

Mode 1: one wavelength fits around the planet. The field swings up on one side of the Earth while it swings down on the other, with a single node ring between them. This is the famous ~7.8 Hz.

Lightning centres · activity now
  • Central Africa
  • South America
  • Maritime Continent

Modeled from lightning climatology: land storms peak around 15:00–17:00 local time. Not a live lightning feed.

Mode shapes are exact for an ideal spherical cavity driven from one point (Legendre polynomials Pn), shown here from the African centre. The day/night line follows the real position of the Sun. A perfect, lossless cavity the size of Earth (6,371 km radius) would ring at 10.6 Hz. The real one rings lower, and the reason is the ionosphere itself.

Why 7.83 Hz?

If the ionosphere were a perfect mirror, a light-speed wave circling the Earth would ring the cavity at about 10.6 Hz. It is not perfect: the wave leaks into the ionosphere, loses energy and slows down. Slow the wave and the note drops. That is where 7.83 comes from.

Real cavity vs perfect cavity

Cyan: modeled spectrum for storms spread over the whole globe. Dashed amber: where a perfect, lossless cavity would ring.

Perfect cavity
10.59 Hz
÷ wave slowdown c/V
1.354
= real mode 1
7.82 Hz
Other worlds
Perfect-cavity ceiling, mode 1
10.6 Hz
radius 6,371 km

Smaller worlds ring higher, like a smaller bell. This is the upper limit for a perfect cavity; a real one always rings lower, by an amount set by its ionosphere. Measured continuously since 1960. Mode 1 near 7.8 Hz.

How this instrument works

The cavity

Complex propagation constant from Ishaq & Jones (1977), the standard empirical fit to worldwide Schumann observations, as restated by Nickolaenko, Galuk & Hayakawa (2016).

The field

The textbook solution for a vertical lightning stroke in a spherical Earth–ionosphere cavity, evaluated with Legendre functions of complex degree.

The lightning

Three tropical centres (Central Africa, South America, the Maritime Continent) whose activity peaks in the local afternoon, as satellite lightning climatology shows. Driven by the real UTC clock. Not a live lightning feed.

The Sun

Live NOAA GOES 1–8 Å X-ray flux. M- and X-class flares raise the modes by up to ~2.5%, following the ~0.2 Hz rise Roldugin et al. (2004) observed during strong bursts.

What it is not: a measurement. It will not show a storm over your town, a local power-line hum, or anything the model leaves out. Its higher modes run a little low, a known limit of the Ishaq & Jones fit. We publish the model because an honest, explained estimate is more useful than a borrowed image nobody can check.

So does it affect us?

That is the question worth asking, and it is still open. We went through every study people cite, with the catch next to each one.

Read: Does the Schumann Resonance Affect Us?

Choose your entry point

One framework. Two ways in.

Study the system in full, or put it to work on your own circuit.

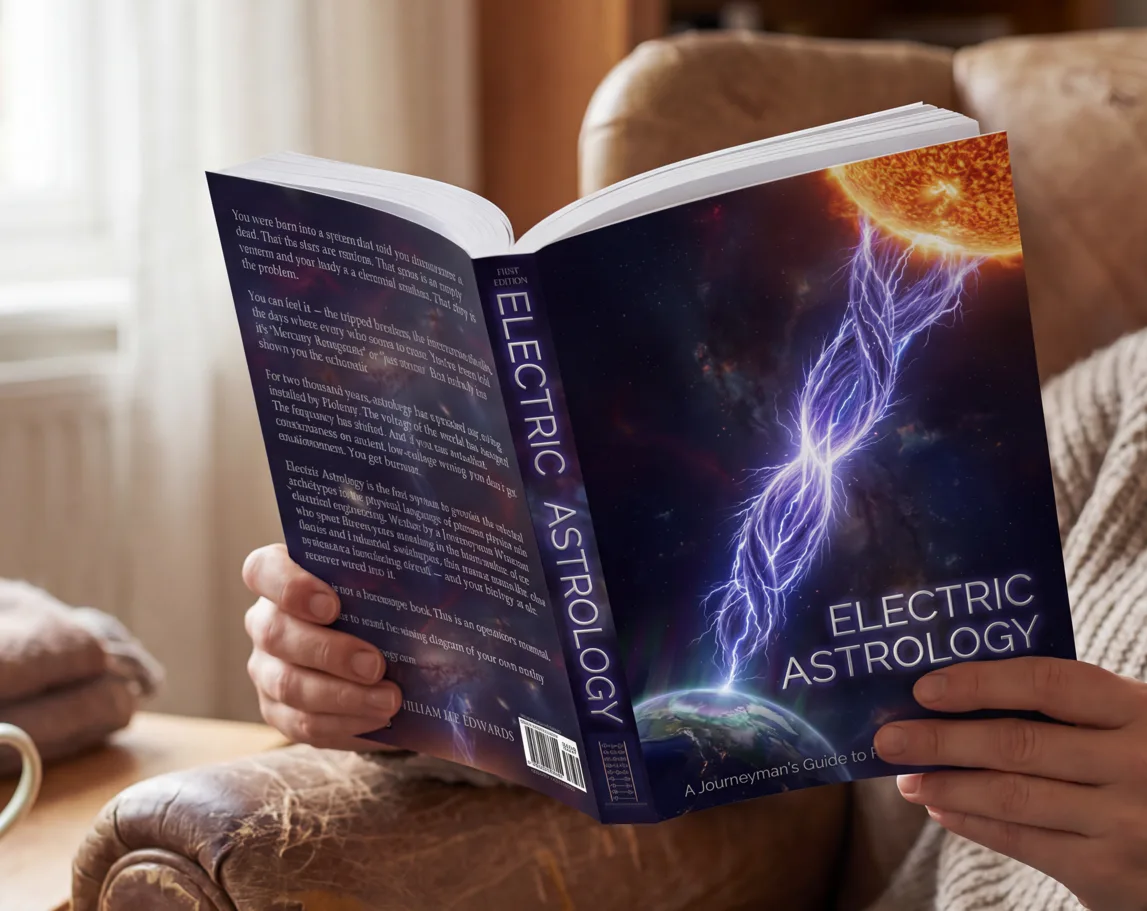
Electric Astrology paperback in hand

Paperback edition

The theory

The Book

The complete theory, cosmology, and operator’s manual.

Follow the argument from the electrical architecture of the solar system to the commissioning logic of the birth chart.

DigitalPaperbackHardbackAudiobook
Discover the Book

Available at Amazon

Amazon's trademark is used under license from Amazon.com, Inc. or its affiliates.
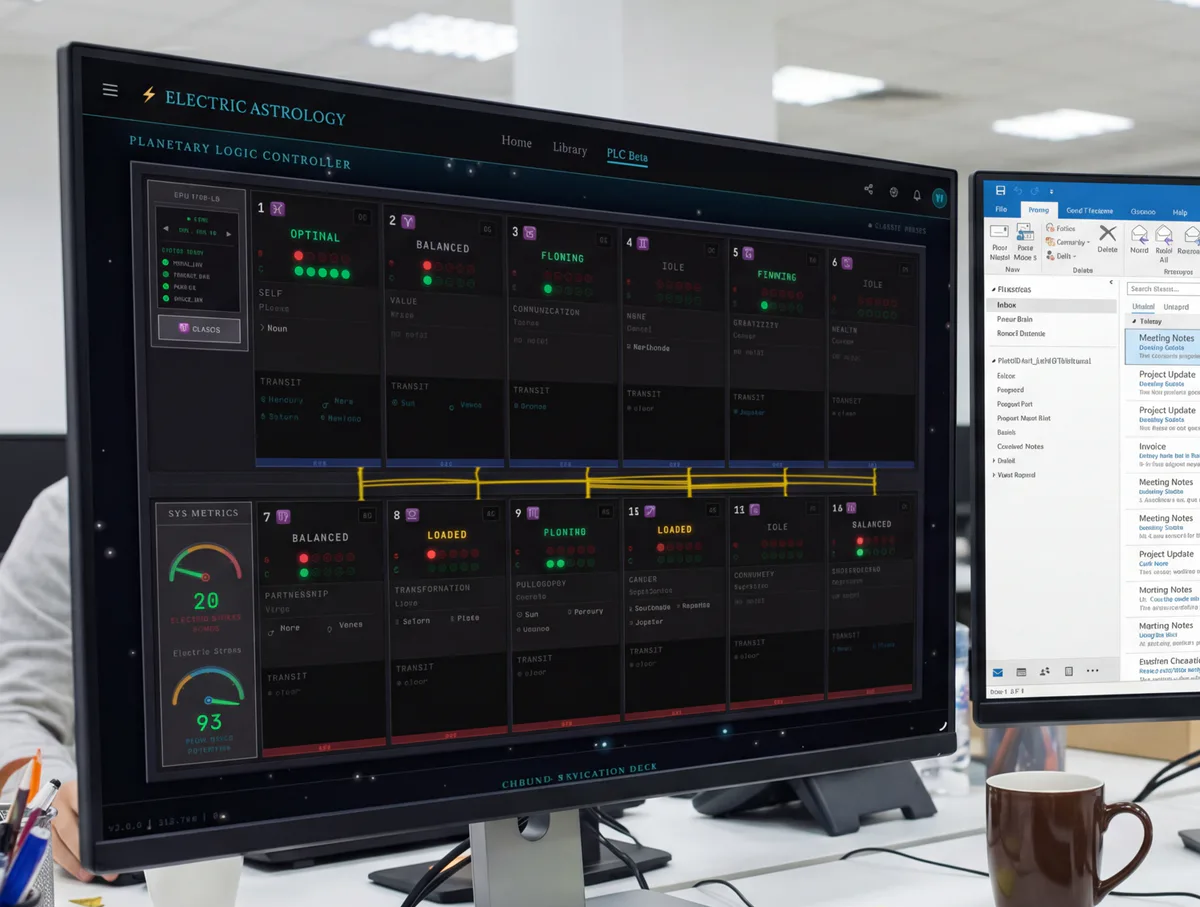
Planetary Logic Controller telemetry deck on a monitor

Planetary Logic Controller

Theory in application

The App

Your natal circuit transformed into a living, personalized instrument.

See the live sky against your commissioning, follow the signal through the PLC, and explore it with Ganymede.

PLCGanymedeOrbital ScopeReports
Explore the App
Download on theApp StoreIn reviewGET IT ONGoogle Play

Common Questions

What is the Schumann resonance today?

The fundamental sits near 7.8 Hz, as it has since measurements began; what changes through the day is its strength. The instrument on this page models the spectrum right now for a chosen observer from the real UTC clock and live NOAA X-ray flux. It is a physics model, clearly labelled MODELED, not a measurement.

Is this a live Schumann measurement?

No. There is no reliable free real-time Schumann data feed; most "live" sites re-post spectrogram images from the Tomsk observatory. Electric Astrology computes its own rendition from published physics (the Ishaq & Jones cavity model, lightning climatology and the measured response to solar X-ray flares) and shows its working.

Why do Schumann resonance charts show spikes?

Spectrogram charts show amplitude as brightness. Bright bursts come from surges in thunderstorm activity, nearby storms and local interference. They are not the frequency "rising": the fundamental stays near 7.8 Hz.

Do solar flares change the Schumann resonance?

Slightly. During strong solar X-ray bursts the first mode has been observed to rise by about 0.2 Hz and the second by about 0.3 Hz for the length of the burst (Roldugin et al. 2004). This instrument applies that effect when GOES reports an M- or X-class flare.

Does the Schumann resonance affect people?

That is an open scientific question. A few small studies report links to blood pressure and heart-rate variability, but none has been replicated at scale. Our full write-up, "Does the Schumann Resonance Affect Us?", goes through the evidence study by study.

The Advantage Over Watching NASA Yourself

Get Storm & CME Alerts

NOAA and NASA publish the numbers. They don't tell you. The moment a geomagnetic storm, a major flare, or an Earth-directed CME is confirmed, we'll email you — no refreshing this page, no scanning raw feeds.

This is the general grid alert — the same one everyone gets. Reading it against your commissioning schematic is what the Planetary Logic Controller does.

Signing up puts you on our list — that's the deal: we watch the sky, you hear from us by email. Unsubscribe from alerts any time. Your newsletter choice remains separate.

Already a member?

Full accounts get the richer channel: push notifications, in-app alerts, and email — all tied to the same PLC dashboard.

Enable Space Weather Alerts in Settings →
More live instruments