Episode 004 · Watch the film

Solar Cycles and Astrology: Why Don’t We Calculate Them?

Astrology says the sky at the minute you were born matters for the rest of your life. We agree. So why does no traditional chart record the two biggest measurements of that minute: how active the Sun was, and what Earth’s magnetic field was doing?

  1. The two readings astrology ignores
  2. What the Sun means vs. what it does
  3. Exhibit A: 275 years of sunspots
  4. Meet Ganymede
  5. The Inhale and the Exhale
  6. May 2024: a solar overload
  7. 2020: a record-quiet Sun
  8. The solar wind is a current
  9. The heliosphere, a clean room
  10. Tchijevsky: revolutions on the peaks
  11. Pandemics in the valleys
  12. Vitality is voltage
  13. Exhibit B: Earth’s magnetic field
  14. 1859: the Carrington Event
  15. 1989: the night Québec went dark
  16. Storms and hearts
  17. My week: October 2020
  18. Back to astrology’s own rule
  19. The case
  20. Where we are now
  21. Find your numbers
  22. The third reading

The short answer

A birth chart is cast for the exact minute you were born. At that minute the Sun was somewhere in its roughly 11-year cycle, counted in sunspots since the 1700s, and Earth’s magnetic field was calm or in a storm, scored on the Kp index since 1932. When astronomers found Uranus, Neptune and Pluto, astrologers added each one to the chart. These two measurements were never added.

Electric Astrology adds them. Every natal schematic records the solar cycle you were born in, where you fell on it, and the sunspot number and the Kp index on the day you came online: your Commissioning Conditions.

Solar cycle explorer · 1749 to now

275 years of the Sun

10020030017501800185019001950200012345678910111213141516171819202122232425NOW · CYCLE 25
Exhale: within a year of a solar maximumInhale: around a solar minimumNumbers above the curve = solar cycle

pandemic · January 2020

The COVID-19 pandemic

Arrives within weeks of the December 2019 solar minimum.

Solar Cycle 25 · The Inhale · solar minimum · 1 month after the minimum that began Cycle 25

What solar cycle were you born in?

Data: 13-month smoothed monthly sunspot number, WDC-SILSO, Royal Observatory of Belgium. The most recent months are provisional.

The chart has grown before

Astrology is not frozen. Every time astronomers found something new in the sky, astrologers made room for it on the chart.

  1. 1781
    Uranus
    Found by William Herschel. Astrology added it to the chart.
  2. 1846
    Neptune
    Found by Galle from Le Verrier’s math. Added.
  3. 1930
    Pluto
    Found by Clyde Tombaugh. Added.
  4. 1843
    The solar cycle
    Found by Heinrich Schwabe. Never added.

People have counted sunspots since the first telescopes in the 1600s. In 1843 Heinrich Schwabe showed they rise and fall in a regular cycle, and a few years later Rudolf Wolf began the count that is still kept today, reconstructed back to 1755 as Solar Cycle 1. Every person alive was born at a known point in a numbered solar cycle. It just isn’t on anyone’s chart.

You’d think the biggest thing in our solar system, doing the biggest thing it does, would have some effect on us. It does.

The solar cycle in six numbers

~11 yrs
One swing of the Sun, quiet to wild and back
1932
Earth’s magnetic field scored every 3 hours since (the Kp index)
1843
The year the sunspot cycle was discovered
25
The numbered solar cycle we live in now
274
Days without a single sunspot in 2019
1 month
From the December 2019 solar minimum to the 2020 pandemic

The Sun is no light bulb

Growing up, we’re taught the Sun just shines, steady as a bulb that never flickers. It doesn’t. It runs in cycles. About every eleven years it swings from quiet to wild and back again. And every cycle its magnetic poles flip, so one full round trip takes about twenty-two years, like alternating current, only very slow.

The Sun’s wind also blows a huge magnetic bubble around the whole solar system, the heliosphere. It works like a shield against the cosmic rays crossing the galaxy. How strong that shield is depends on where the Sun is in its cycle.

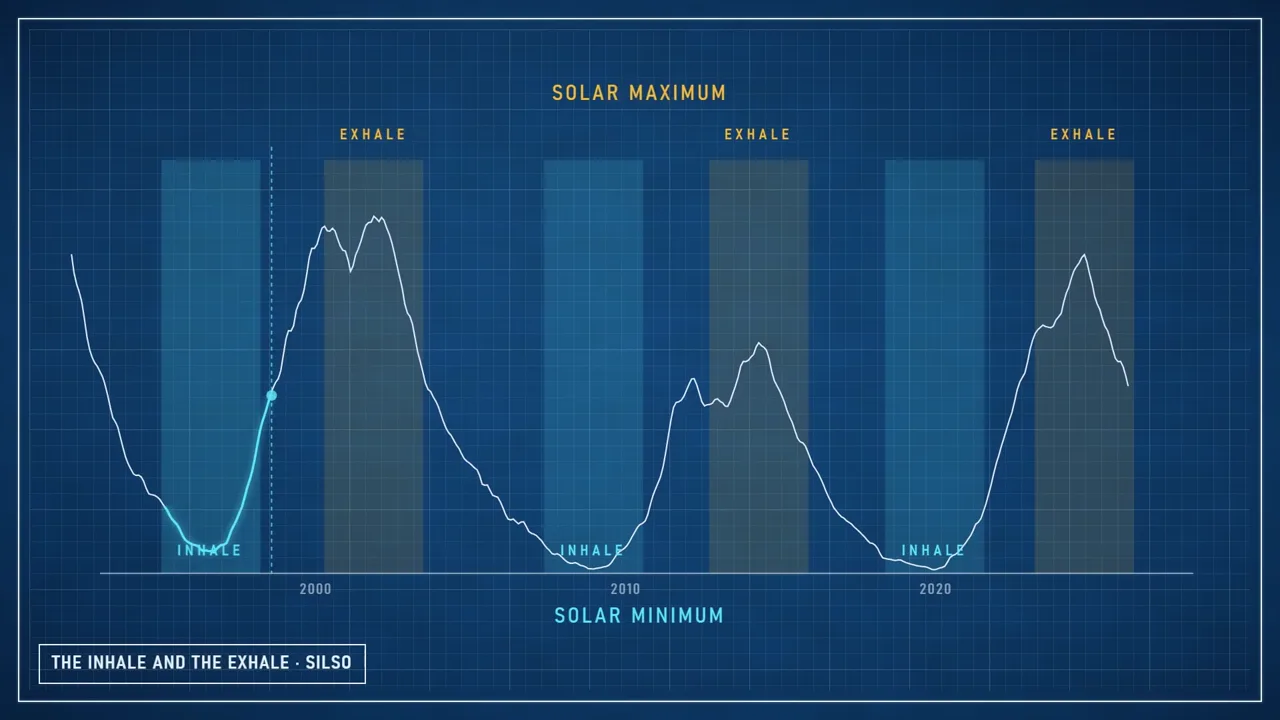
The Inhale · solar minimum

The sunspots disappear and the solar wind calms down. The heliosphere shrinks, the shield weakens, and galactic cosmic rays reach deeper into our atmosphere. Quiet does not mean safe.

The Exhale · solar maximum

The surface breaks out in sunspots. Flares and coronal mass ejections hammer Earth’s magnetic field. The shield against cosmic rays is at its strongest, but the system is running hot.

The Tchijevsky Index

We aren’t the first to notice. In the 1920s, the Russian biophysicist Alexander Tchijevsky drafted what he called the Index of Mass Human Excitability. Going back through history to the 5th century BC, he compared wars, revolutions and mass riots with the solar cycle, and reported that about eighty percent of the most significant events came near the peak of the cycle.

Stalin didn’t like the idea that the Sun was in charge instead of the State. He sent Tchijevsky to the Gulag.

Here are the major revolutions of the last 250 years, placed on the cycle. Turn on the revolutions layer in the explorer above to see them on the curve.

Major revolutions and where each began in the solar cycle
BeganEventCycleWhere in the cycle
Jul 1776American independence3The Inhale · solar minimum · 13 months after the minimum that began Cycle 3
Jul 1789The French Revolution4Falling toward the Inhale · 17 months after the Cycle 4 peak
Jul 1830The July Revolution7The Exhale · solar maximum · 8 months after the Cycle 7 peak
Feb 1848The Revolutions of 18489The Exhale · solar maximum · the month of the Cycle 9 peak
Mar 1871The Paris Commune11The Exhale · solar maximum · 7 months after the Cycle 11 peak
Jan 1905Russia, 190514Rising toward the Exhale · 13 months before the Cycle 14 peak
Nov 1910The Mexican Revolution14Falling toward the Inhale · 57 months after the Cycle 14 peak
Oct 1911The Xinhai Revolution14Falling toward the Inhale · 68 months after the Cycle 14 peak
Nov 1917The Russian Revolution15The Exhale · solar maximum · 3 months after the Cycle 15 peak
Oct 1949The Chinese Revolution18Falling toward the Inhale · 29 months after the Cycle 18 peak
Oct 1956The Hungarian Revolution19The Exhale · solar maximum · 12 months before the Cycle 19 peak
May 1968The protests of 196820The Exhale · solar maximum · 6 months before the Cycle 20 peak
Feb 1979The Iranian Revolution21The Exhale · solar maximum · 10 months before the Cycle 21 peak
Nov 1989The fall of the Berlin Wall22The Exhale · solar maximum · 4 months after the Cycle 22 peak
Jan 2011The Arab Spring24Rising toward the Exhale · 39 months before the Cycle 24 peak

Pandemics at the solar minimum

The Inhale has its own pattern. Pandemics tend to show up at the bottom of the cycle, when the Sun goes quiet and the shield comes down. The Russian flu of 1889 hit about three months before a solar minimum. The flu of 1977 came about a year after one. The 2009 swine flu arrived four months after one. And the pandemic of 2020 began the same month the Sun hit bottom, December 2019. Not every pandemic lands at the bottom: the 1918 flu came closer to a peak. But the last two both arrived within months of a minimum.

Pandemics and where each began in the solar cycle
BeganEventCycleWhere in the cycle
Dec 1889The “Russian flu”12The Inhale · solar minimum · 3 months before the minimum that ended Cycle 12
Mar 1918The 1918 influenza15The Exhale · solar maximum · 7 months after the Cycle 15 peak
Feb 1957The 1957 “Asian flu”19The Exhale · solar maximum · 8 months before the Cycle 19 peak
Jul 1968The 1968 “Hong Kong flu”20The Exhale · solar maximum · 4 months before the Cycle 20 peak
May 1977The 1977 “Russian flu”21The Inhale · solar minimum · 11 months after the minimum that began Cycle 21
Apr 2009The 2009 H1N1 pandemic24The Inhale · solar minimum · 4 months after the minimum that began Cycle 24
Jan 2020The COVID-19 pandemic25The Inhale · solar minimum · 1 month after the minimum that began Cycle 25

The second measurement: Earth’s magnetic field

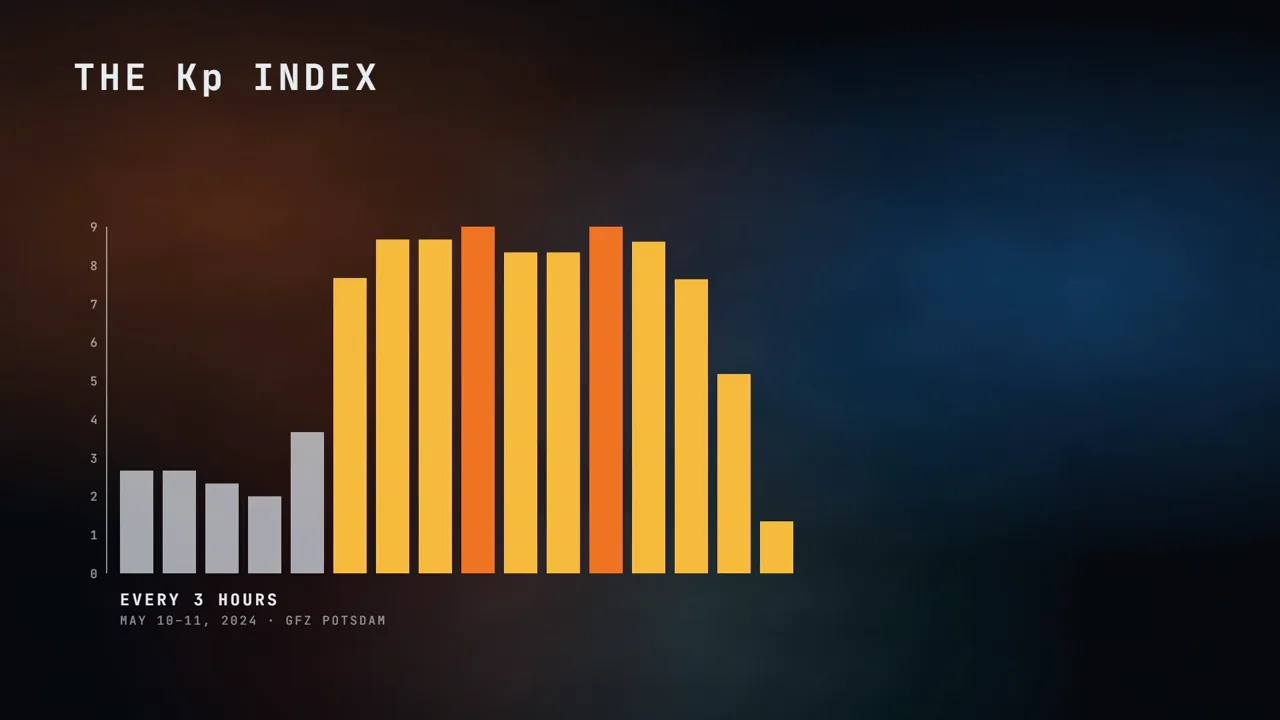
The Sun pushes on Earth’s magnetic field all the time. When a burst from the Sun hits it, the field shakes: a geomagnetic storm. In 1949 the German geophysicist Julius Bartels gave it a score, the Kp index, from 0 (calm) to 9 (extreme), every three hours, from a network of 13 magnetic observatories. GFZ Potsdam has calculated it back to 1932.

It is strong enough to run our wiring. In September 1859, during the most intense geomagnetic storm on record, telegraph keys threw sparks, and operators in Boston and Portland disconnected their batteries and kept sending on the “auroral current.” On March 13, 1989, the Kp index hit 9 and Hydro-Québec’s grid went down in under 90 seconds, leaving about six million people without power for about nine hours. Both storms came near the peak of a solar cycle.

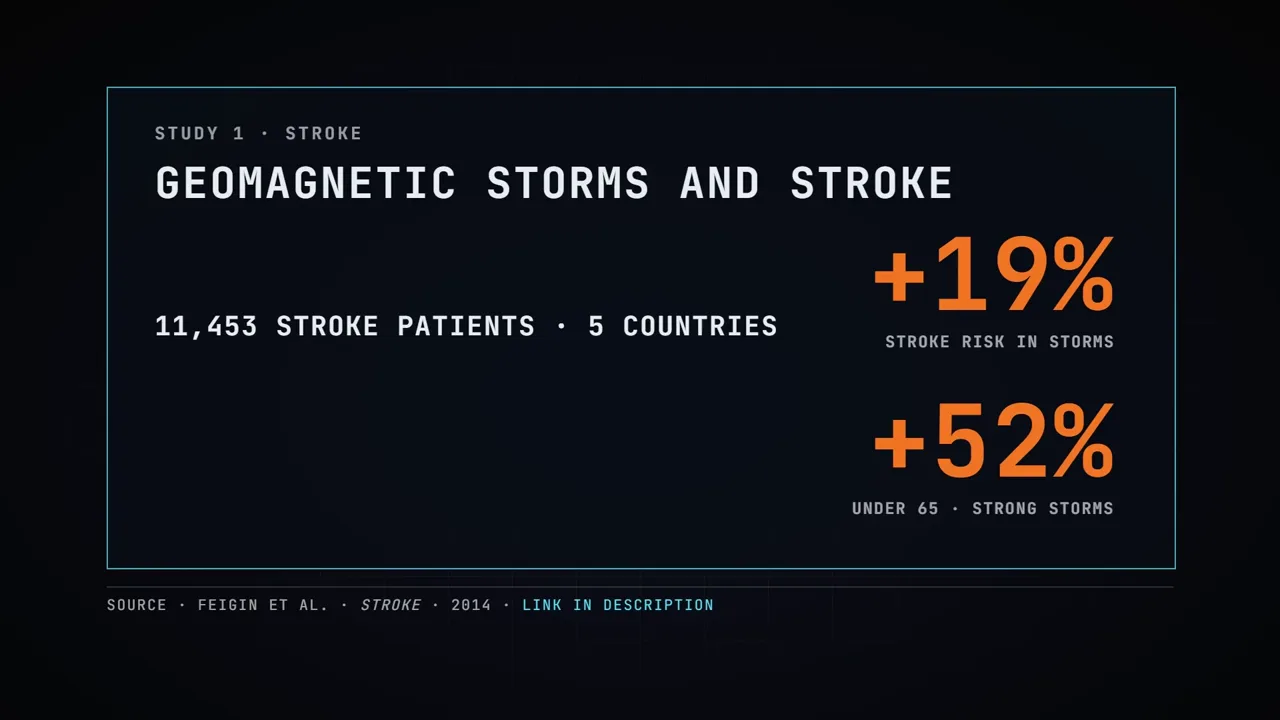
And it shows up in hospital data, the field called heliobiology. Across 11,453 stroke patients in five countries, geomagnetic storms came with a 19% higher stroke risk, and 52% higher for people under 65 in strong storms. A 2025 study from Brazil found more heart attacks on disturbed days, especially in women. Researchers working with NASA found heart-rate variability moving with solar and geomagnetic activity. And in Baku, sudden cardiac deaths rose with cosmic rays, the particles a quiet Sun lets in.

2020 Hindsight

In December 2019, the Sun reached the bottom of Solar Cycle 24, the deepest minimum in a century. That year it went 274 days without a single sunspot, more than any year since 1913. With the shield down, cosmic rays climbed, and in 2020 they came within one percent of the highest level ever recorded by the neutron monitor in Oulu, Finland.

Down on the ground, the whole world went through the same year. Heart attack deaths in America rose fourteen percent in the first year of the pandemic, and in the second year deaths among people aged 25 to 44 ran almost thirty percent above what was expected. The usual explanations are the virus and people staying away from hospitals. Those are real. The sky was doing something too.

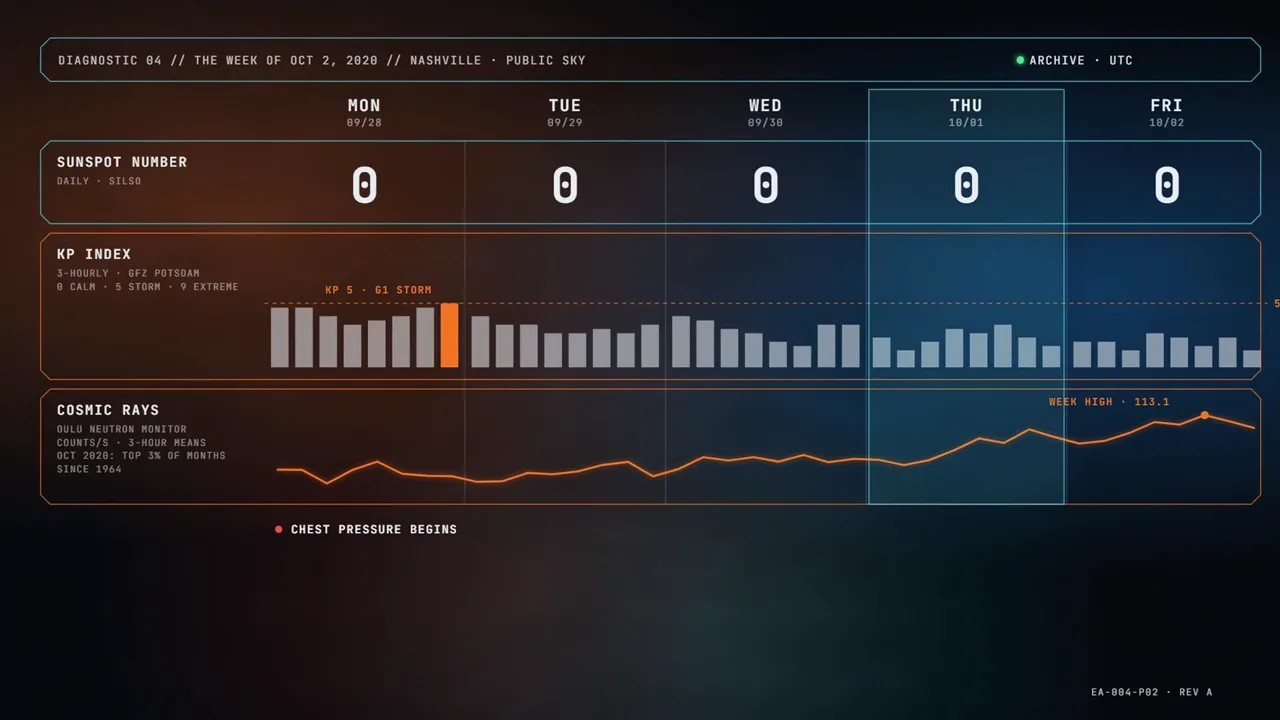
William Edwards was one of those heart attacks, at 36, in the first week of October 2020. The blockage was real and the doctors saved his life. The conditions that week were measurable: the sunspot number was zero every day from Saturday, September 26 to Friday, October 2, and on Monday the 28th, the day his chest pressure began, the Kp index reached 5, a geomagnetic storm. That Thursday the Moon was full. The next film picks up there.

When you’re born matters

A study of 8,662 people born in Norway between 1676 and 1878 found that those born when the Sun was quiet lived about five years longer, on average, than those born when it was active. The researchers still debate why.

That is why Electric Astrology puts the solar cycle on the chart. Your natal schematic includes a Commissioning Conditions panel: the solar cycle you were born in, its phase, the sunspot number, and the geomagnetic Kp index on the day you were born. No other astrology calculates it.

Right now we live in Solar Cycle 25. It peaked around October 2024, and the Sun is on its way down from the Exhale. Find your own year on the curve above, then see the day on your schematic.

The full transcript

The narration as recorded, corrected only for transcription errors. Tap a time to play the film from that moment.

01

The two readings astrology ignores

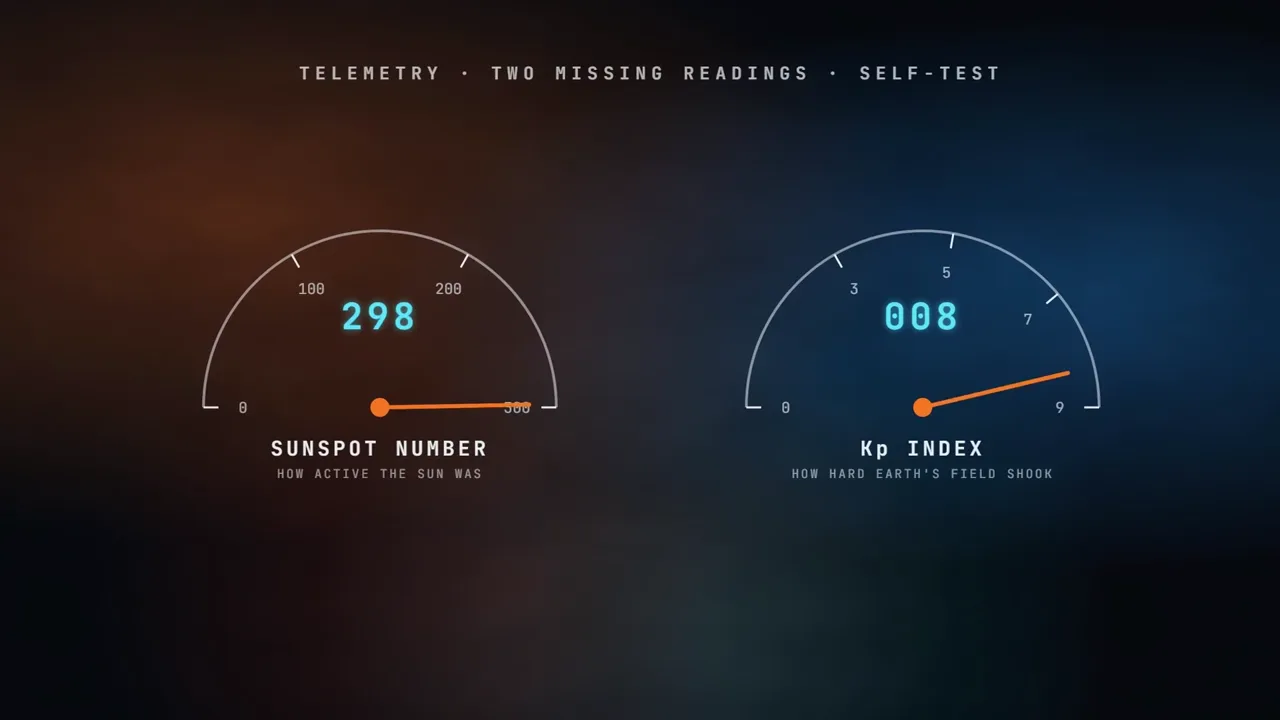
Astrology claims the exact minute you were born matters for the rest of your life. And I think that’s right. So why does every traditional birth chart ignore the two biggest readings in the sky at that exact minute? How active the Sun was, counted in sunspots. And how hard the Earth’s magnetic field was shaking, measured on the Kp index.

Astrology made room for Uranus in 1781, Neptune in 1846, Pluto in 1930. The moment an astronomer spotted a new planet, it went straight onto your chart. Yet the Sun’s pulse and the Earth’s magnetic storm index got left off the board, and nobody ever went back to fix it.

These two numbers aren’t trivia. When the Sun peaks, telegraphs have caught fire and revolutions line up on the peaks. When it goes quiet, pandemics line up in the valleys. And when Earth’s field storms, strokes and heart attacks go up. That last one is personal for me. In October 2020, under a Sun that didn’t have a single sunspot, I woke up with two stents in my chest.

If the minute you were born really matters, why are we reading the chart with the power supply unplugged? Let’s look at the telemetry.

Two gauges: the sunspot number and the Kp index
From the film · 1:10
02

What the Sun means vs. what it does

In astrology, the Sun is the big one. It’s your self, your vitality, the king of the chart. Astrologers have been reading it that way for thousands of years, and as far as it goes, I don’t argue with it. That’s what the Sun means.

In my book, I wrote that we’re not just going to learn what the Sun means, we’re going to learn what it does. Because what the Sun does changes a lot, and it gets measured every single day.

03

Exhibit A: 275 years of sunspots

So let me show you the two measurements astrology leaves out. Exhibit A is the Sun itself. Exhibit B is the Earth’s magnetic field.

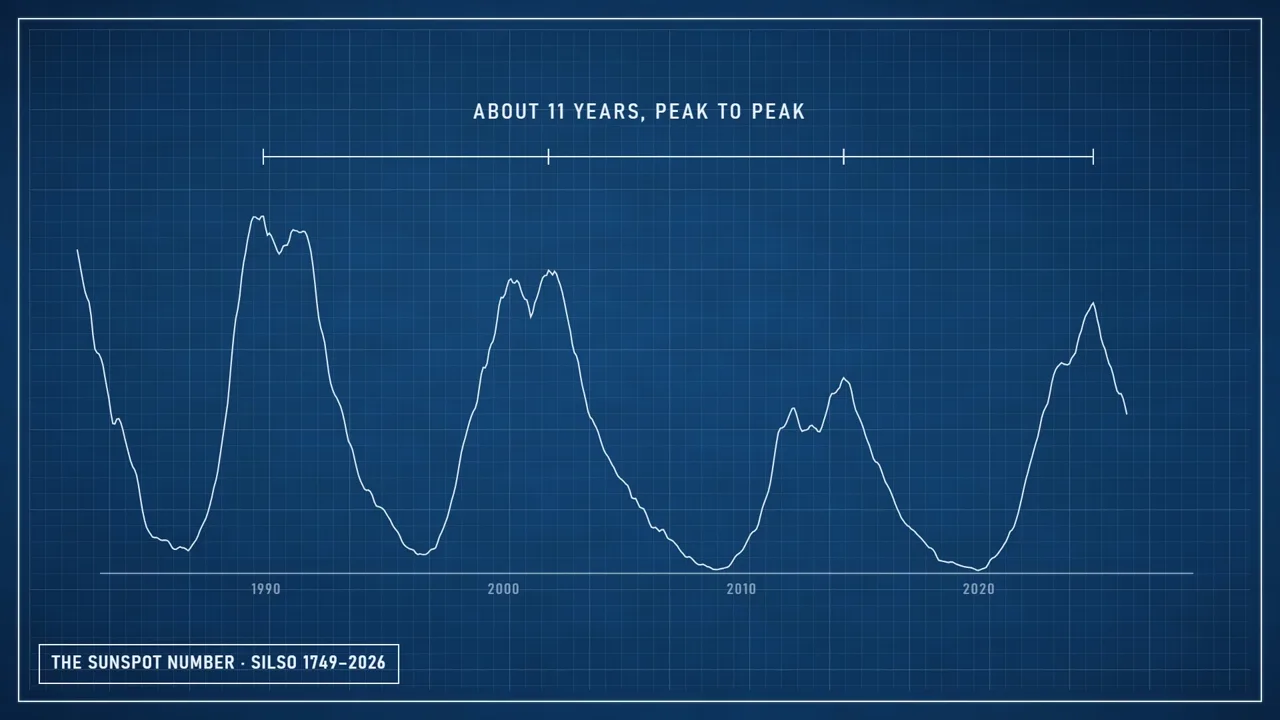
People have been watching sunspots through telescopes since around 1610. Galileo was one of them. In 1843, a German astronomer named Heinrich Schwabe, who’d been counting sunspots for 17 years, noticed that they came and went in a cycle. After him, Rudolf Wolf came up with the sunspot number and traced the cycle back into the 1700s. We still use his count today. Now we know the cycle runs about 11 years.

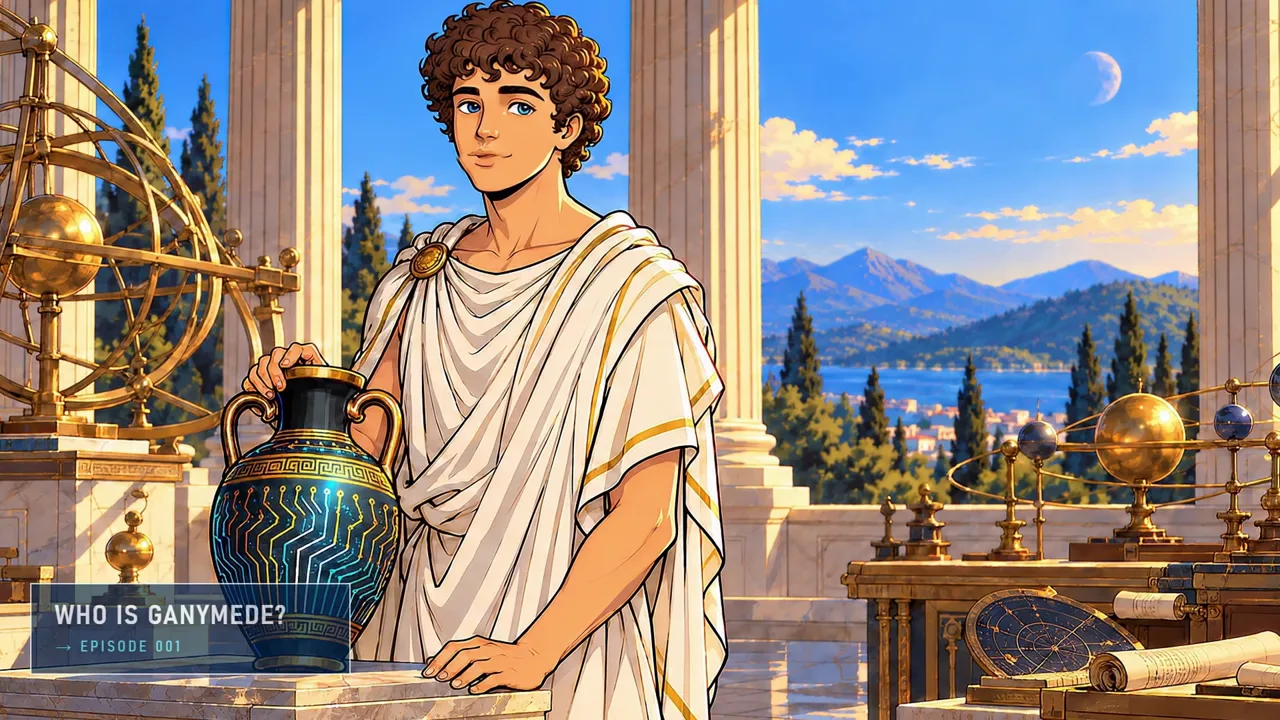
That’s how we found the cycle. But to explain what the Sun actually does over those 11 years, I’m going to hand it to somebody who’s had a better seat than any of us. In Greek myth, Zeus carried a young man named Ganymede up to Mount Olympus. For over 3,400 years he’s poured for the gods and watched the solar system turn from the top of the mountain. He’s my guide on this channel, and he reads the instruments for me.

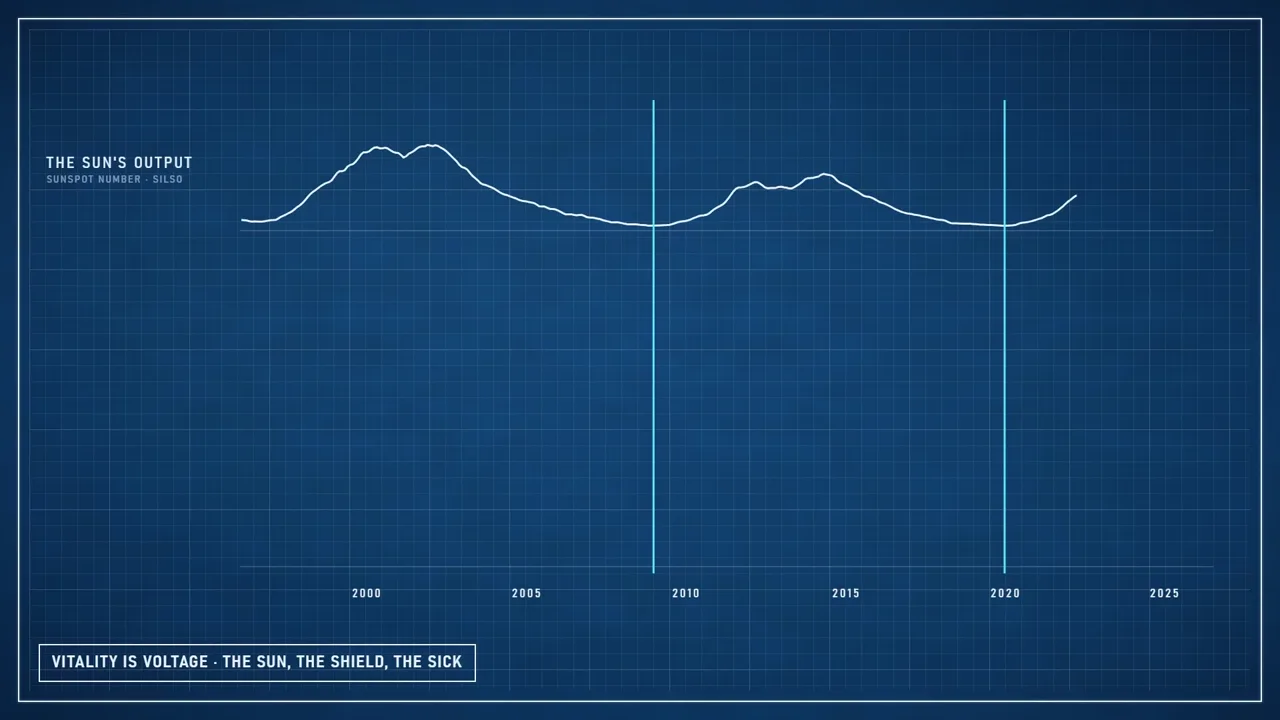
The SILSO sunspot number, about 11 years peak to peak
From the film · 2:30
04

Meet Ganymede

Meet Ganymede. Ganymede, walk us through those 11 years.

GanymedeThank you, William, and hello, everyone. It’s a pleasure to finally meet you. Like William said, I’ve spent a very long time up on that mountain, watching the current run through the solar system. And I learned it from the master of lightning himself, Zeus. So from time to time, I’ll be jumping in to explain things the way the big electric guy explained them to me.

GanymedeSo. At the bottom of the cycle the Sun goes quiet: few sunspots, some days none at all. Then it builds: more sunspots, flares, eruptions. And at the peak, the Sun’s magnetic poles flip. North becomes south. Then it winds back down and starts over. The last peak came in October 2024; NASA and NOAA announced it that month. Right now, we’re on the way down.

Ganymede with his amphora on Olympus
From the film · 3:06
05

The Inhale and the Exhale

In the book, I call the two halves of the cycle the inhale and the exhale. The inhale is solar minimum. The exhale is solar maximum. Hold on to those.

The solar cycle with its inhale (solar minimum) and exhale (solar maximum) bands
From the film · 4:15
06

May 2024: a solar overload

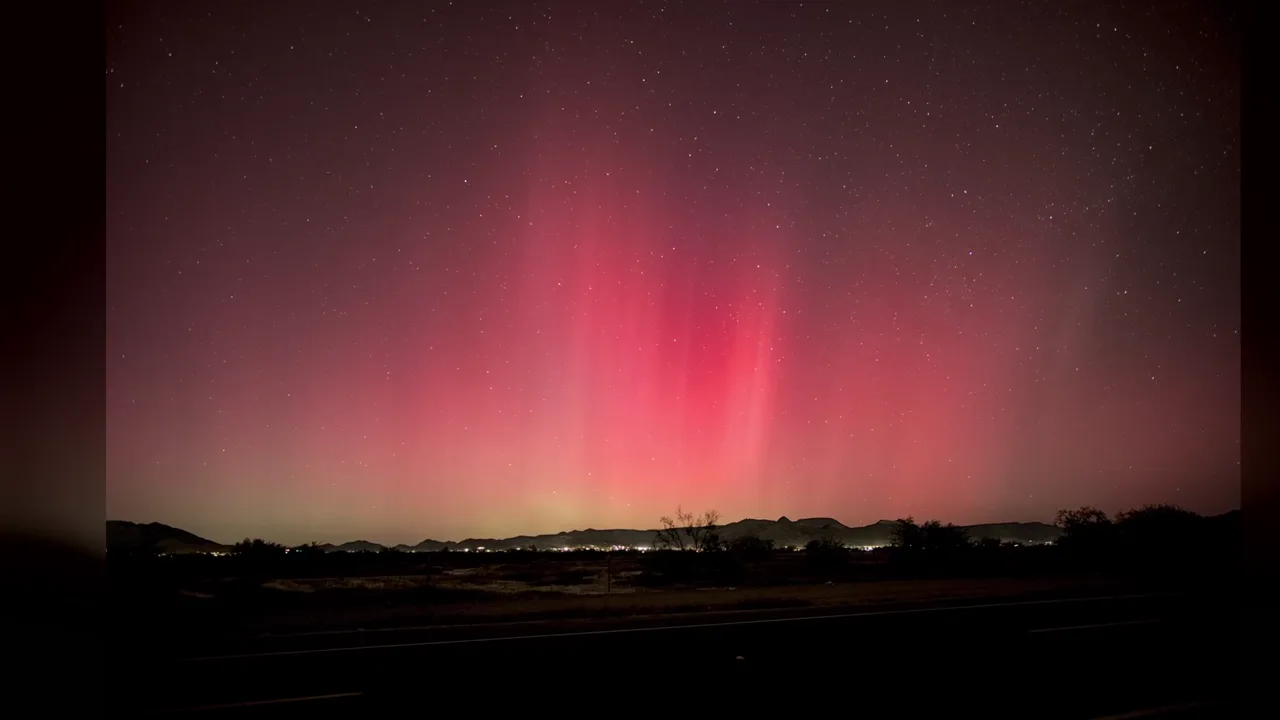
Think back to May 2024. Millions of us walked outside in Texas, Tennessee, all the way down into Mexico, and saw the sky glowing magenta. A sunspot cluster 16 times wider than Earth had just thrown eruption after eruption straight at us. The strongest storm in 20 years.

To an electrician, that glow isn’t just pretty light. That’s an overload. High voltage jumping the gap across space. A solar arc flash that makes anything on our power grid look like a spark.

The magenta aurora of May 2024
From the film · 4:25
07

2020: a record-quiet Sun

But 2020 wasn’t an overload. It was the opposite. The Sun had gone quiet. Record quiet.

08

The solar wind is a current

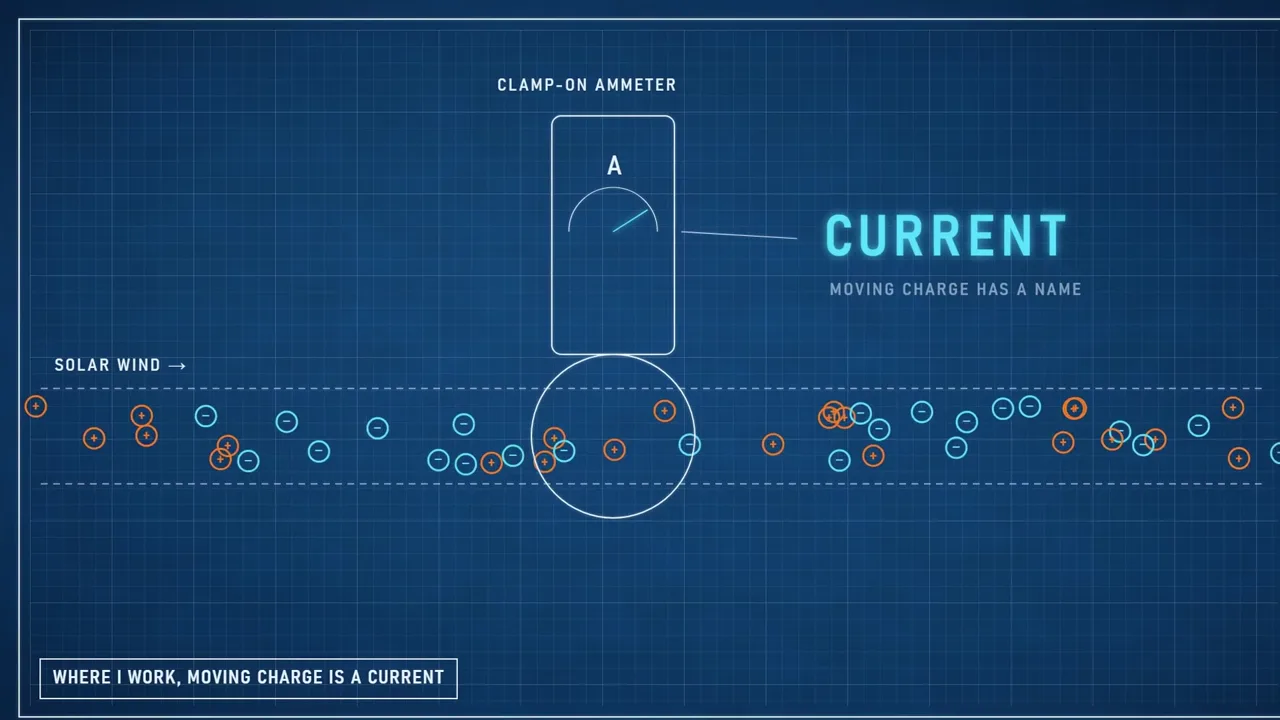
I’m an electrician, so let me say it the way I see it. The solar wind isn’t really wind. It’s a stream of charged particles, protons and electrons. Where I work, moving charge has a name. It’s a current. And the Sun doesn’t behave like a campfire. Ganymede?

GanymedeOne. The surface of the Sun is about 5,500 degrees Celsius. Its outer atmosphere, the corona, is millions of degrees. You walk away from the fire and it gets hotter. Scientists call it the coronal heating problem, and it still isn’t fully solved. Two. Sunspots are dark because they’re cooler than the surface around them. If all the heat came from deep inside, a hole in the surface should glow brighter, not darker. Three. The solar wind speeds up as it leaves the Sun. NASA built the Parker Solar Probe partly to find out how.

GanymedeWilliam’s book reads all three the same way. The Sun behaves less like a furnace and more like an electrical component: a substation.

That’s chapter 2 of my book, “The Solar Substation.” You don’t have to buy that whole model to follow the rest of this. Just hold on to one fact. The Sun puts out a stream of charge, and it changes with the cycle.

Drawing sheet: a clamp-on ammeter around the solar wind reads CURRENT
From the film · 5:21
09

The heliosphere, a clean room

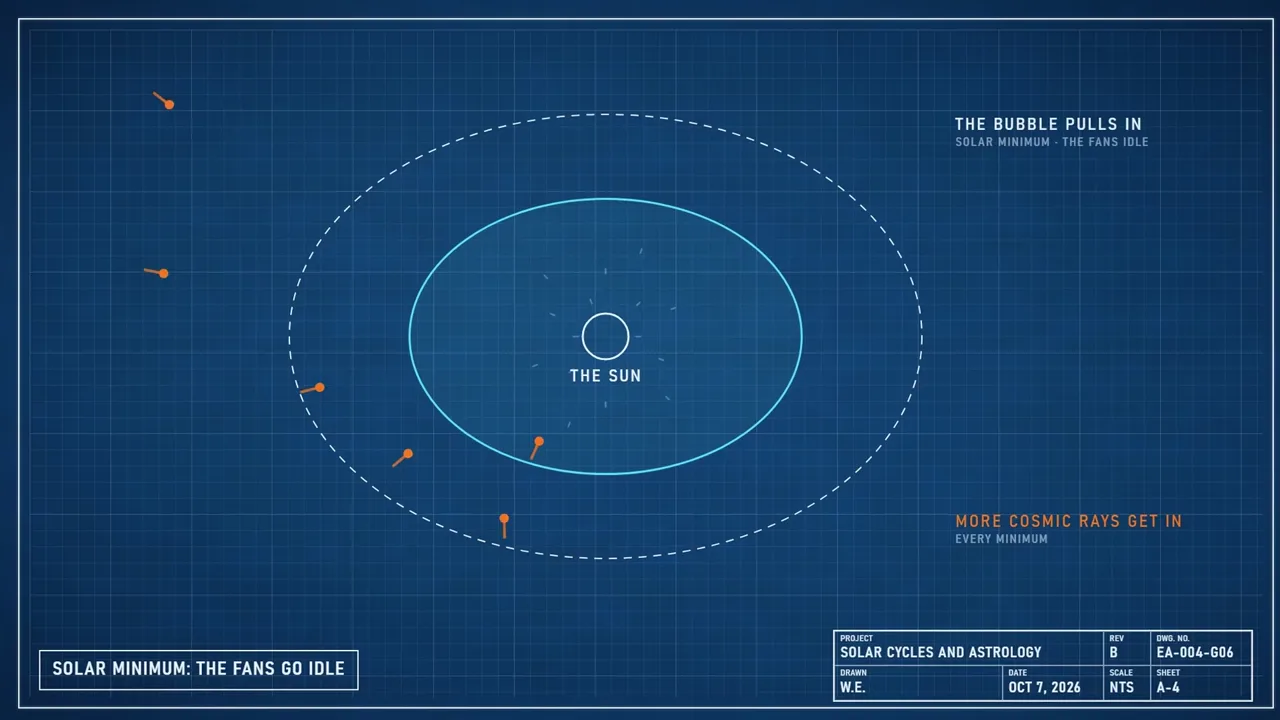
The solar wind blows a giant bubble around the whole solar system. It’s called the heliosphere. In my book, I compare it to a clean room. The fans keep positive pressure and the junk stays out. The junk is cosmic rays: particles from outside the solar system, coming in at nearly the speed of light.

At solar minimum, the fans go idle. The bubble weakens and more cosmic rays get in. Every minimum. In 2019, the Sun went blank for 274 days, the most since 1913. And in 2019 and 2020, the cosmic rays coming in hit the highest levels of the space age. Quiet doesn’t mean safe.

So if the solar cycle really has an effect on us, you’d expect to see it in history, on both ends.

Drawing sheet: the heliosphere pulls in at solar minimum and more cosmic rays get in
From the film · 7:00
10

Tchijevsky: revolutions on the peaks

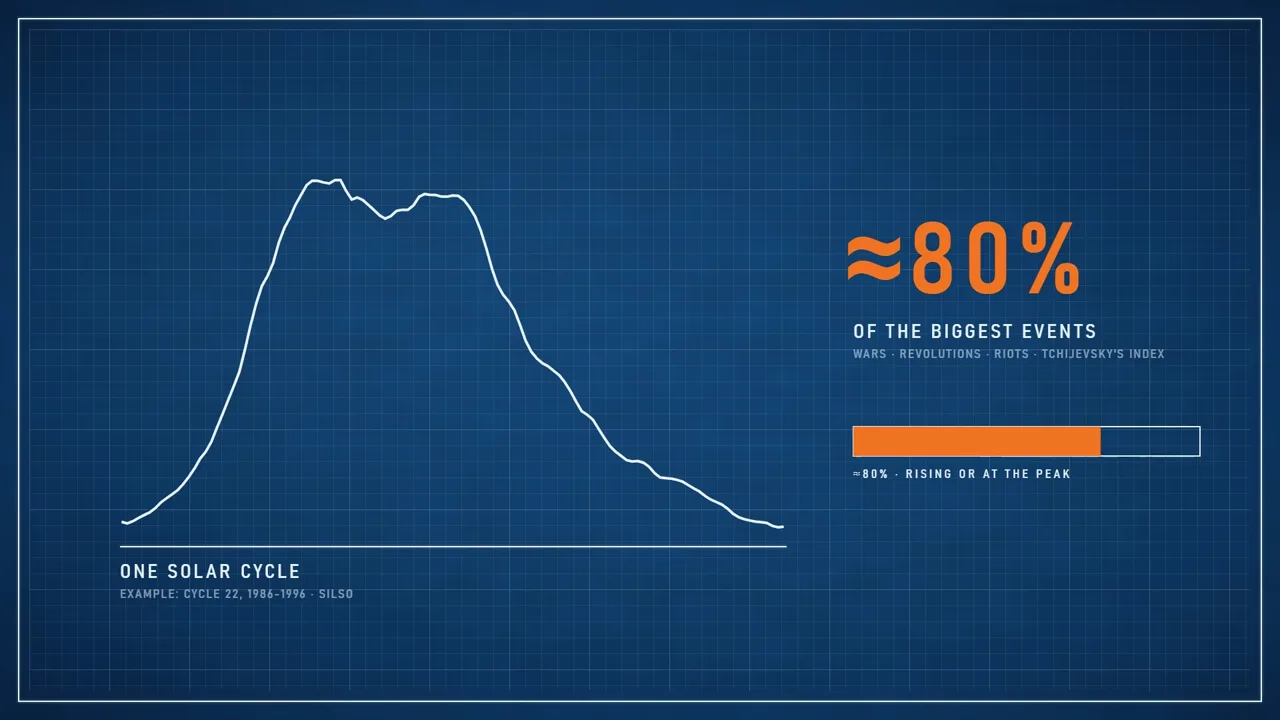
In the 1920s, a Russian scientist named Alexander Tchijevsky went looking. He went back through history, all the way to the 5th century BC, and lined up wars, revolutions and riots against the solar cycle. He called it the Index of Mass Human Excitability. He found that about 80% of the biggest events happened while the Sun was building toward its peak, or at it. Stalin didn’t like the idea that the Sun was in charge instead of the state, so he sent Tchijevsky to the gulag.

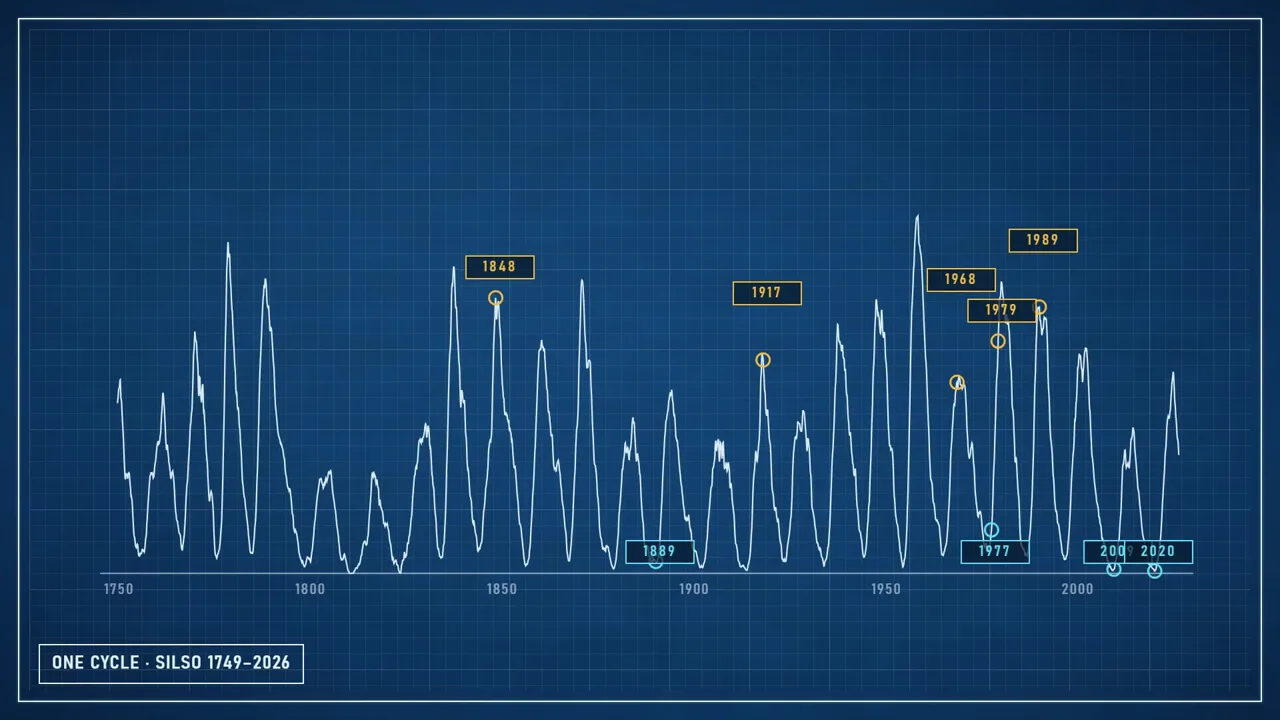
So I checked his work, and I put the revolutions on the curve myself. 1848: revolutions sweep across Europe. The Sun peaked that same month. 1917: the Russian Revolution, three months after a peak. 1968: protests all over the world, six months before a peak. 1979: the Iranian Revolution, within a year of a peak. 1989: the Berlin Wall comes down, the same year the Sun peaked.

Now, not every one lines up, and Tchijevsky never said they all did. But put them on a curve and look for yourself.

And here’s one thing in history that got looked over. Astrologers tie Uranus to revolution, partly because it was found in 1781, right in the age of the American and French revolutions. But the Sun peaked in 1778, in the middle of the American Revolution, and again in 1788, the year before the French one. The Sun was peaking right there both times. It just never got the credit.

One solar cycle: about 80% of the biggest events, rising or at the peak
From the film · 8:00
11

Pandemics in the valleys

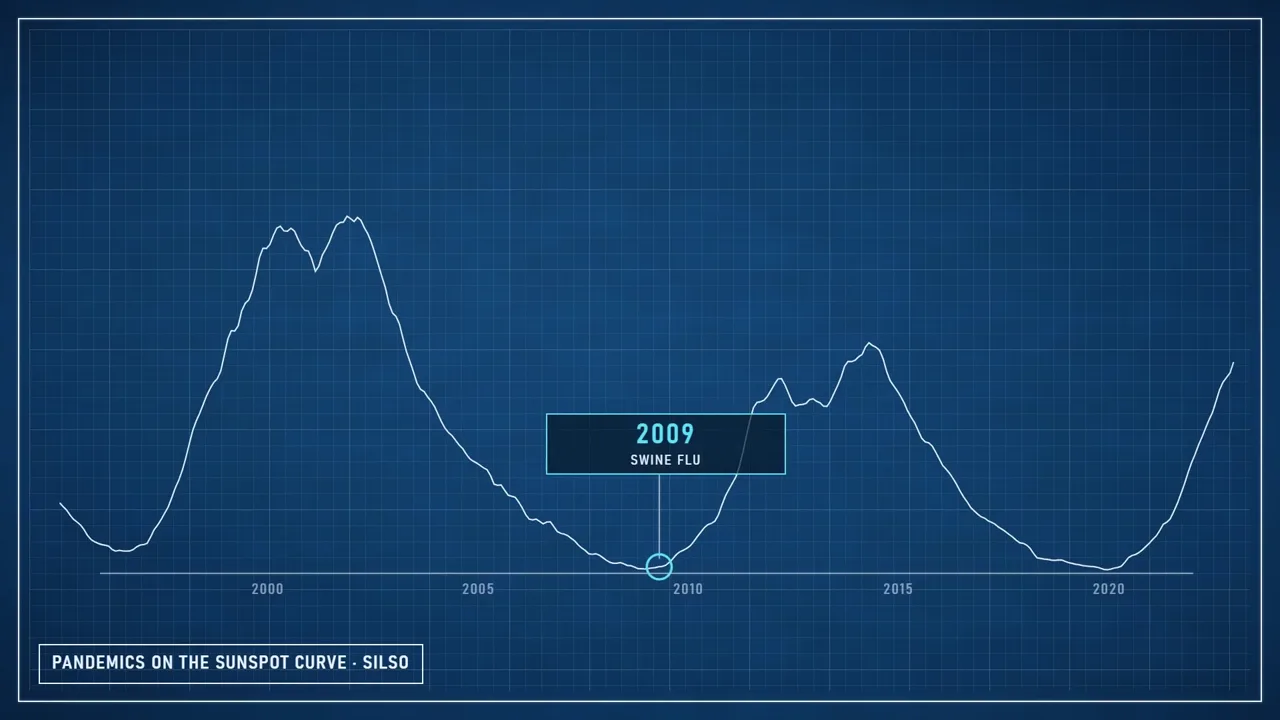
Now the inhale. When the shield drops, the pattern is pandemics. The Russian flu of 1889, about three months before a solar minimum. The flu of 1977, about a year after one. Swine flu, 2009, four months after one. And the pandemic of 2020 started the same month the Sun hit bottom: December 2019.

Now, not every pandemic lands at the bottom. The 1918 flu hit closer to a peak. But the last two, 2009 and 2020, both showed up within months of a solar minimum. That’s worth asking about. That’s the inhale. The Sun bottoms out, the shield drops, and the cosmic rays come in.

Pandemics on the sunspot curve: 2009 swine flu at a solar minimum
From the film · 9:50
12

Vitality is voltage

And remember what astrology says the Sun rules? Your vitality. In my book, I put it plainly: vitality is voltage. So when the Sun’s output drops, the shields come down and sickness spreads, that’s not three separate stories. If astrology is right about the Sun and vitality, it’s one story.

That’s Exhibit A. One number, the sunspot count. And it lines up with all of that. And it’s not on your chart.

One story: the Sun’s output, the shield and sickness on one sheet
From the film · 10:40
13

Exhibit B: Earth’s magnetic field

Earth has its own magnetic field, and the Sun is pushing on it all the time. When a big burst from the Sun hits it, the field shakes. That’s a geomagnetic storm.

In 1949, a German physicist named Julius Bartels came up with a way to score it: the Kp index. Zero to nine, every three hours, from a network of magnetic observatories. And it’s been calculated all the way back to 1932. Zero is calm. Five is a storm. Nine is as bad as it gets.

The Kp index: Earth’s magnetic field scored every three hours
From the film · 11:30
14

1859: the Carrington Event

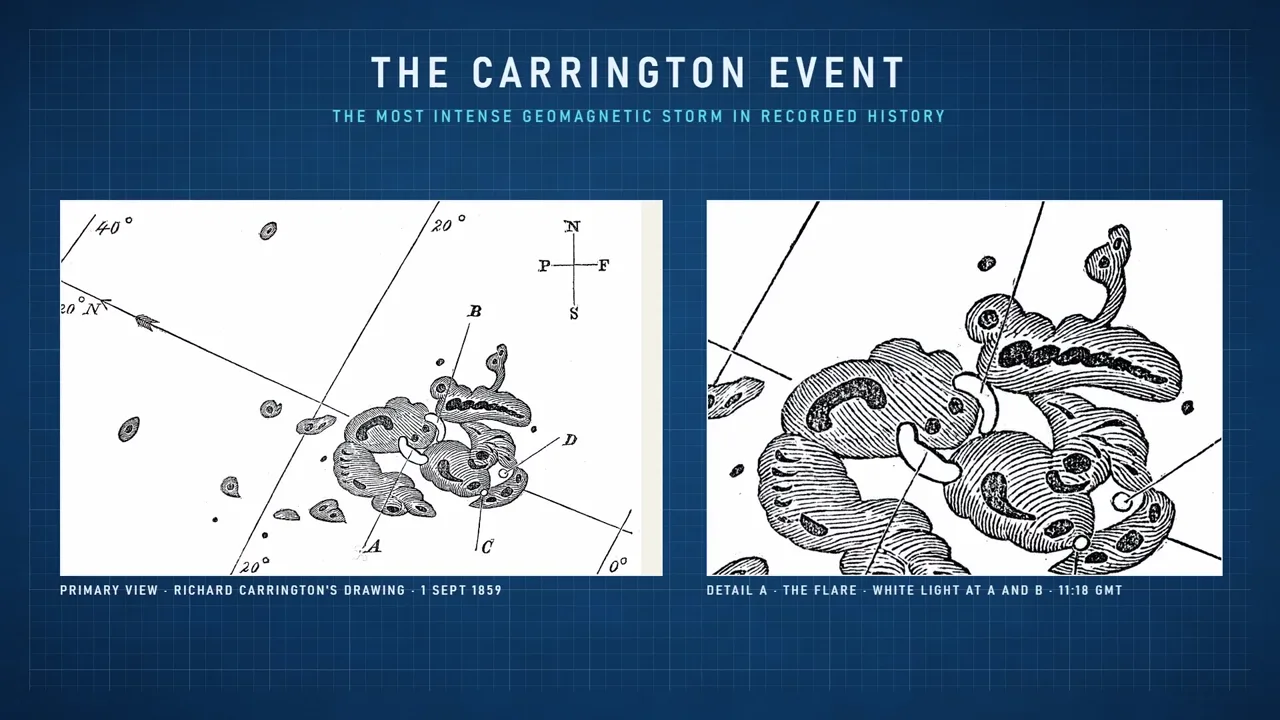
Before there was a Kp index, there was 1859. September 1859, the most intense geomagnetic storm in recorded history. Telegraph keys threw sparks, operators got shocked, paper caught fire.

And in Boston and Portland, the operators disconnected their batteries and kept sending messages anyway, on what they called the auroral current. The sky was running their line. That storm hit near the peak of a solar cycle.

Richard Carrington’s drawings of the September 1, 1859 flare
From the film · 11:55
15

1989: the night Québec went dark

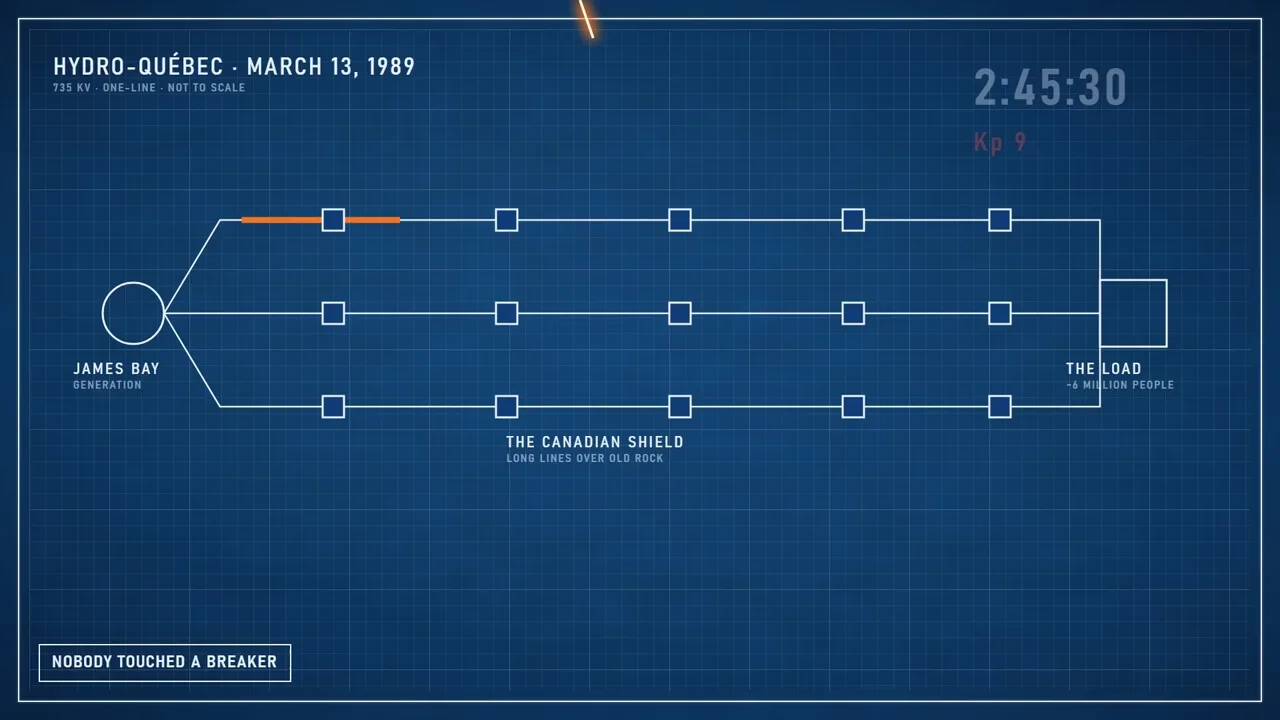
March 13th, 1989, 2:44 in the morning. The Kp index hits nine, and in less than 90 seconds the Hydro-Québec grid goes down. About six million people, lights out for about nine hours.

As an electrician, that one gets me. Nobody touched a breaker. The current came down out of the sky into those long transmission lines, and the protection did what it’s built to do. It tripped. That was near the top of a solar cycle too. The two numbers work together.

The Hydro-Québec grid, March 13, 1989, 2:45 a.m.
From the film · 12:45
16

Storms and hearts

So if the field can trip a power grid, the next question is whether it shows up in our bodies. There’s a field of science that studies exactly that. It’s called heliobiology.

A study in the journal Stroke looked at more than 11,000 stroke patients in five countries. During geomagnetic storms, the risk of stroke went up 19%. For people under 65, in strong storms, it went up 52%. A 2025 study out of Brazil, using the Kp index, found more heart attacks on days when the Earth’s magnetic field was disturbed, especially in women. Researchers working with NASA recorded people’s heart rhythms for five months and found that they moved with the changes in solar and geomagnetic activity.

And this one ties both exhibits together. A study of 788 sudden cardiac deaths in Baku found the deaths went up with cosmic rays, and down when the Sun and the magnetic field were active. A quiet Sun lets the cosmic rays in, and sudden cardiac death went up with them. That’s the inhale, showing up in the medical data.

Which brings us back to 2020. In the first year of the pandemic, heart attack deaths in America went up 14%. The year after that, for people 25 to 44, they ran almost 30% higher than predicted. The usual explanations are the virus and people staying away from hospitals. Those are real, but the sky was doing something too.

I was one of those heart attacks. October 2020, 36 years old.
Study card: geomagnetic storms and stroke, +19%, and +52% under 65
From the film · 13:33
17

My week: October 2020

Last episode, I told you I went back and looked at the sky over that day, and here’s what the numbers said.

It started on a Monday, September 28th: a pressure in my chest that wouldn’t go away. The sunspot number that day was zero, and it stayed zero every day that week. The Kp index that Monday hit five, a geomagnetic storm. It had been stirred up for days. Cosmic rays were running near the highest levels we’ve measured in the modern space age. And by Thursday of that week, the field had gone quiet.

And on Friday, I was down on the floor of a machine shop, working on a machine that couldn’t find its zero point. And neither could I. I drove myself to the ER, and next thing you know, when I woke up, I had two stents in my chest.

The blockage was real, and the doctors saved my life. And I’m not saying the sky gave me a heart attack. I’m saying I was already close to the edge, and the sky just pushed me over.

Readout of the week of October 2, 2020: sunspots zero every day, the Kp index and cosmic rays
From the film · 15:42
18

Back to astrology’s own rule

So let’s get back to astrology’s own rule. The sky at the minute you were born matters. At that minute, the Sun was somewhere in its cycle: the same cycle that lines up with revolutions at the peaks and pandemics at the bottom, and decides how many cosmic rays get in. And Earth’s magnetic field was either calm or in a storm: the same field that took down a power grid and shows up in stroke and heart data. Both of those had a real number at the minute you were born, measured and on the record.

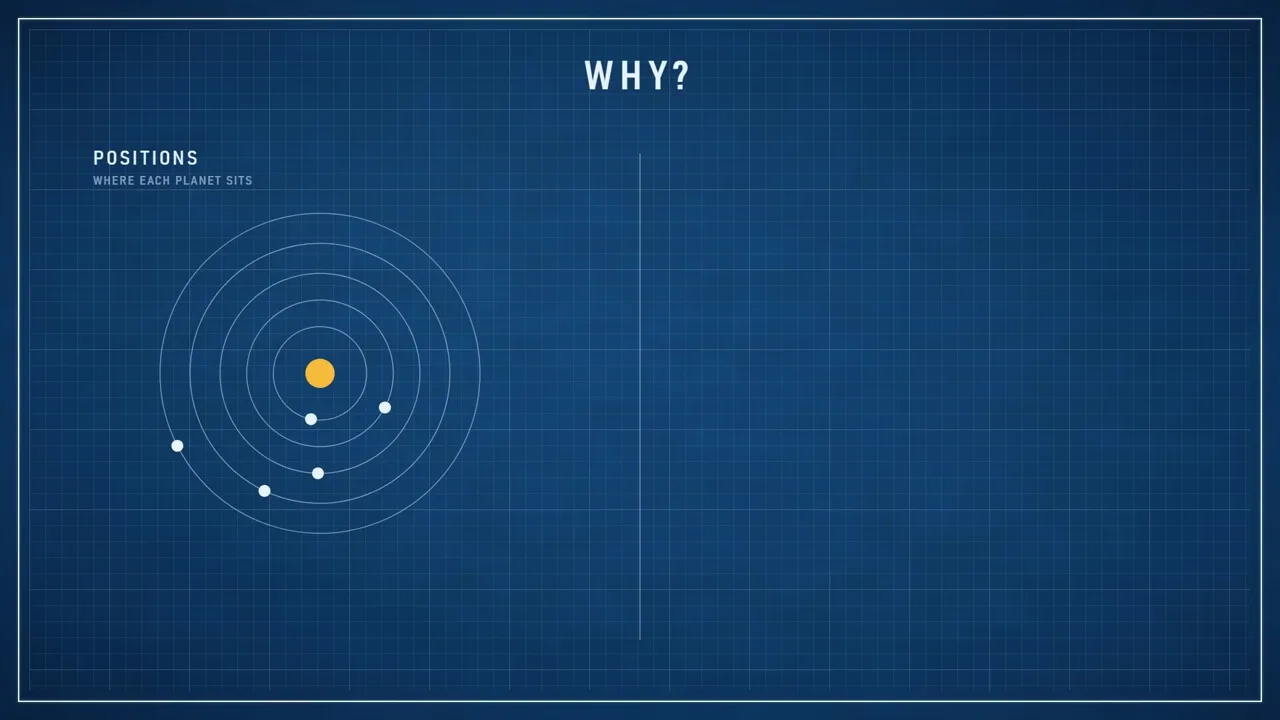
Astrology wrote down where the Sun and the planets were, all to the degree, but left both of those numbers out. Here’s my best answer for why. Astrology’s math was built for positions. Where each planet sits, you can work that out from a table for any date a thousand years back. The Sun’s cycle and magnetic fields aren’t positions. They’re conditions. You can’t look them up in a table. Someone has to measure them.

Astrology made room for Uranus in 1781, Neptune in 1846, Pluto in 1930, all three found with telescopes. Two measurements we’ve kept since the 1700s and since 1932 never made it onto the chart. If the minute matters, then everything we can measure about that minute matters, not just where the planets were.

Positions can be looked up in a table; conditions have to be measured
From the film · 17:20
19

The case

So here’s the case. Astrology says the minute you were born matters. I agree. At that minute, the Sun was somewhere in an 11-year electric cycle, and we’ve counted it since the 1700s. Earth’s magnetic field was calm or it was in a storm, and we’ve measured it since 1932. Both of them trip our wiring, line up with our history and show up in our hearts. And neither one is in your birth chart.

The sunspot number from 1749 to today, with history marked on the curve
From the film · 16:40
20

Where we are now

So where are we now? Solar Cycle 25 peaked in October 2024, and we’re on the way down. And at the minute you were born, the Sun and the field each had a number.

21

Find your numbers

Here’s how you find yours. Download the Electric Astrology app and build your natal schematic. Right alongside your planets, it shows the sunspot number and the Kp index on the day you were born. We call that your Commissioning Conditions. You can also visit the website, electricastrology.com, and see where your birth year lands on the solar cycle.

As far as I know, no other astrology out there calculates it. What those numbers do to a person is the next big question, but you can’t answer it if you never write them down.

22

The third reading

When I first pulled the numbers for the week of my heart attack, those were the two I looked at: the Sun and the magnetic field. I almost missed the third one. Thursday night, October 1st, 2020, the Moon was full.

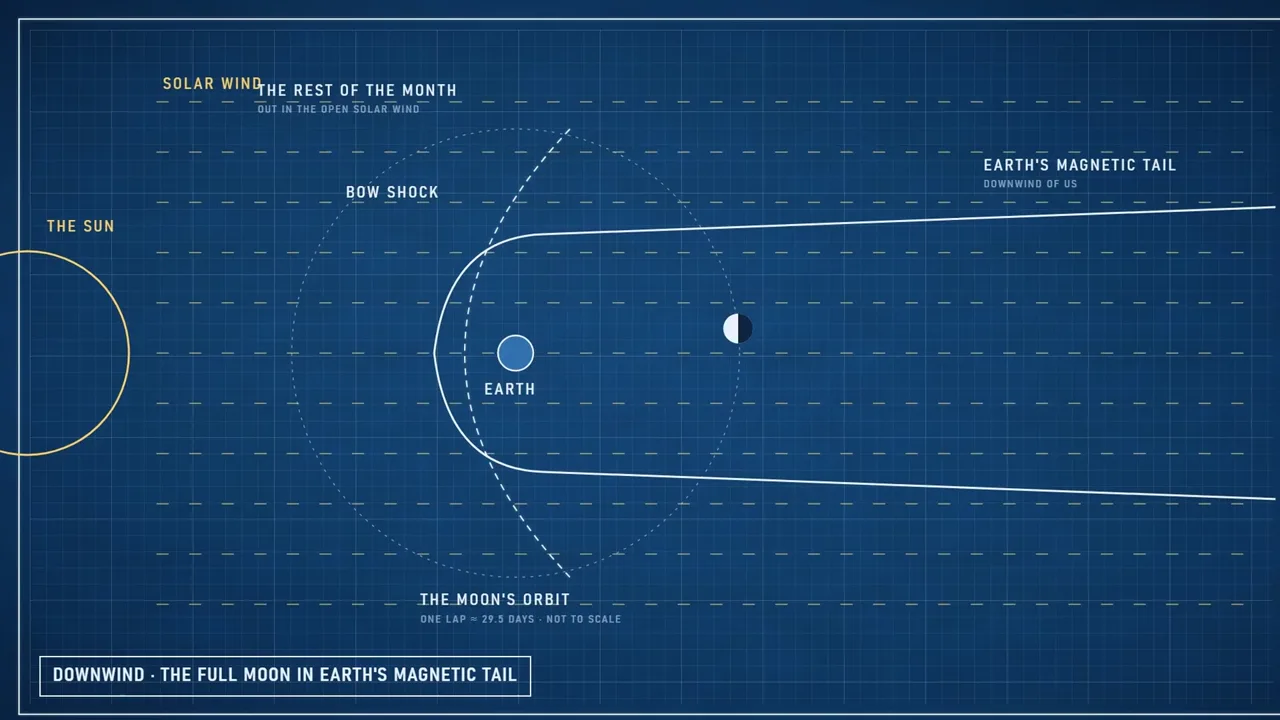
And a full moon isn’t out in the open solar wind the way it is the rest of the month. It’s downwind of us, inside the Earth’s magnetic tail, out in the exhaust of the same field we’ve been talking about this whole time. The next day, I was on the floor of that machine shop.

Drawing sheet: at full moon, the Moon sits downwind inside Earth’s magnetic tail
From the film · 19:50

Keep following the wire

The live instruments, articles and films this episode connects to.

Questions people ask

Why doesn’t astrology track solar cycles?

Astrology’s math was built for positions. Where each planet sits can be worked out from a table for any date a thousand years back. The Sun’s cycle and Earth’s magnetic field aren’t positions, they’re conditions: you can’t look them up in a table, someone has to measure them. So astrology wrote down where the Sun and planets were, to the degree, and left both measurements out. When astronomers found Uranus (1781), Neptune (1846) and Pluto (1930), each went straight onto the chart. The sunspot cycle, known since 1843, never did.

What is the solar cycle?

About every 11 years the Sun swings from quiet to wild and back. At the bottom (solar minimum) it goes quiet, with few sunspots and some days none at all. Then it builds: more sunspots, flares and eruptions. At the peak (solar maximum) its magnetic poles flip, north becomes south, and then it winds back down and starts over. Heinrich Schwabe noticed the cycle in 1843 after 17 years of counting sunspots, and Rudolf Wolf’s sunspot number traced it back into the 1700s. Electric Astrology calls the two halves the inhale (minimum) and the exhale (maximum).

Where are we in the solar cycle right now?

We are in Solar Cycle 25. NASA and NOAA announced that it peaked in October 2024, and the Sun is now on its way down toward the next minimum.

What is the Kp index?

The Kp index scores how hard Earth’s magnetic field is shaking, from 0 to 9, every three hours, from a network of magnetic observatories. Julius Bartels introduced it in 1949, and it has been calculated back to 1932. Zero is calm, five is a storm, nine is as bad as it gets. On NOAA’s scale a G1 storm is Kp 5 and a G2 storm is Kp 6.

What happened in the Carrington Event and the 1989 Québec blackout?

In September 1859, the most intense geomagnetic storm in recorded history, telegraph keys threw sparks, operators got shocked and paper caught fire; in Boston and Portland, operators disconnected their batteries and kept sending messages on what they called the auroral current. On March 13, 1989, at 2:44 in the morning, the Kp index hit 9 and in less than 90 seconds the Hydro-Québec grid went down: about six million people lost power for about nine hours. Both storms came near the peak of a solar cycle.

Do revolutions and pandemics line up with the solar cycle?

In the 1920s Alexander Tchijevsky lined up wars, revolutions and riots back to the 5th century BC against the solar cycle and found about 80% of the biggest events came while the Sun was building toward its peak or at it. The 1848 revolutions, 1917, 1968, 1979 and 1989 all fell near peaks. Pandemics tend to show up near the bottom, when the Sun’s shield against cosmic rays is weakest: the 1889 flu about three months before a minimum, the 1977 flu about a year after one, the 2009 swine flu four months after one, and the 2020 pandemic in the same month as the December 2019 minimum. Not every event fits (the 1918 flu came closer to a peak), so put them on the curve and look for yourself.

Do geomagnetic storms affect the heart?

The field that studies this is heliobiology. A study in the journal Stroke of more than 11,000 patients in five countries found stroke risk rose 19% during geomagnetic storms, and 52% for people under 65 in strong storms. A 2025 study from Brazil found more heart attacks on geomagnetically disturbed days, especially in women. Researchers working with NASA found people’s heart rhythms moved with solar and geomagnetic activity, and a study of 788 sudden cardiac deaths in Baku found deaths rose with cosmic rays. These are measured associations, not destiny: in William’s words, he was already close to the edge, and the sky pushed him over.

How do I find the solar cycle and Kp index for the day I was born?

Enter your birth month and year in the solar cycle explorer on this page to see your cycle number, where you landed on it, and the smoothed sunspot number that month. The Electric Astrology app goes further: build your natal schematic and, right alongside your planets, it shows the sunspot number and the Kp index on the day you were born. We call those your Commissioning Conditions.

Sources

One tap

Should the solar cycle be on every birth chart?

Choose your entry point

One framework. Two ways in.

Study the system in full, or put it to work on your own circuit.

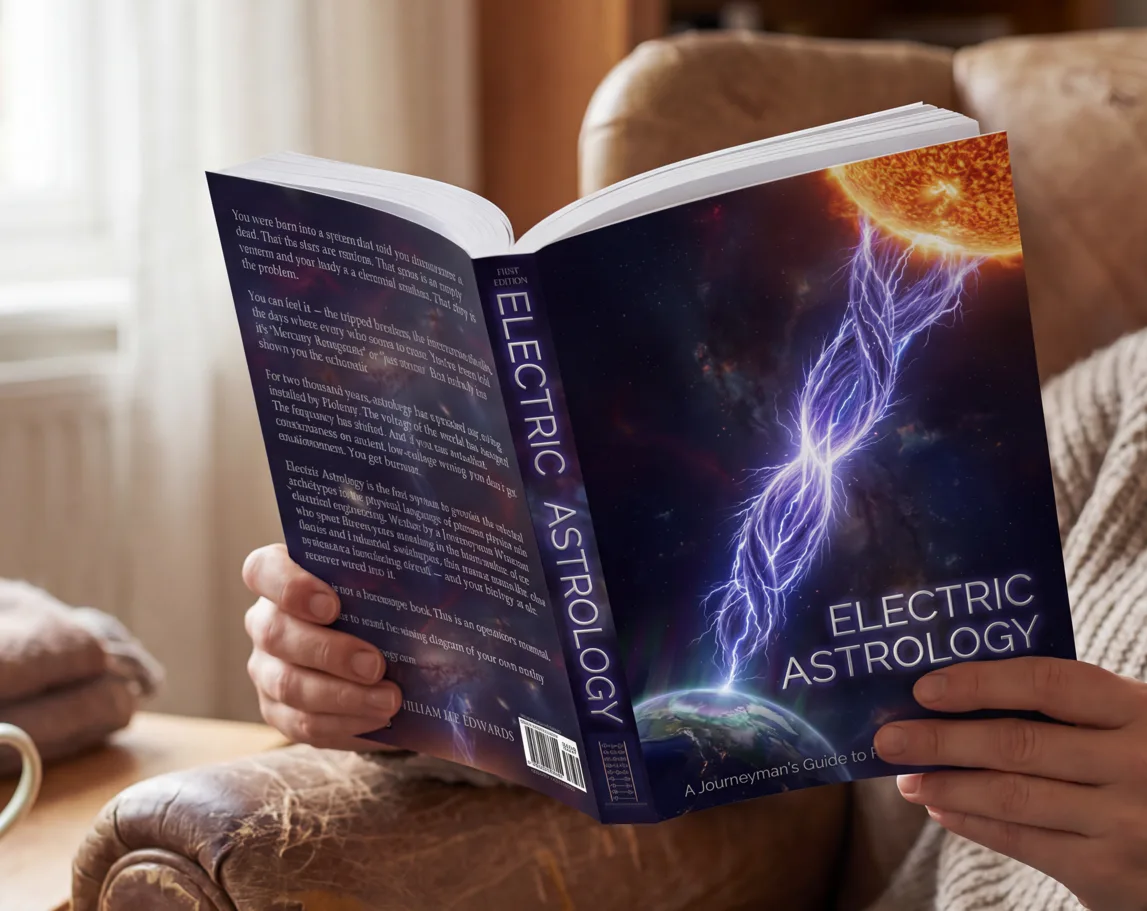
Electric Astrology paperback in hand

Paperback edition

The theory

The Book

The complete theory, cosmology, and operator’s manual.

Follow the argument from the electrical architecture of the solar system to the commissioning logic of the birth chart.

DigitalPaperbackHardbackAudiobook
Discover the Book
Available at Amazon

Amazon's trademark is used under license from Amazon.com, Inc. or its affiliates.

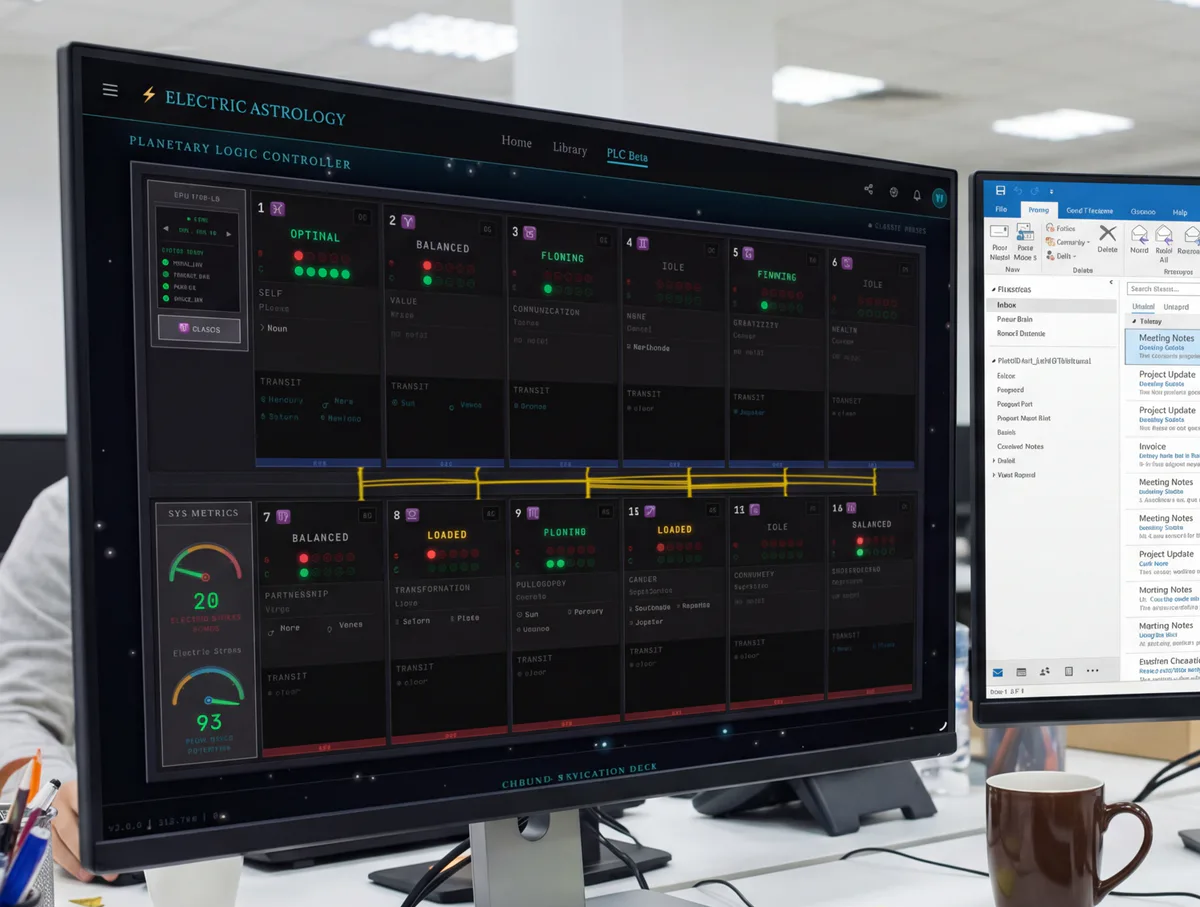
Planetary Logic Controller telemetry deck on a monitor

Planetary Logic Controller

Theory in application

The App

Your natal circuit transformed into a living, personalized instrument.

See the live sky against your commissioning, follow the signal through the PLC, and explore it with Ganymede.

PLCGanymedeOrbital ScopeReports